| Fire incidents reported |
|---|
| Sreet name | Count |
|---|
| ROBINSON RD | 12 | | ELY RD | 8 | | MILL ST | 8 | | US 31 HWY | 8 | | BRYANT RD | 6 | | PLAINS RD | 6 | | REED RD | 6 | | RINGLER RD | 6 | | VAN RD | 6 | | 1669 N LARKS LAKE RD | 4 | | BOGARDUS STREET | 4 | | INDUSTRIAL DR | 4 | | LARKS LAKE RD | 4 | | MILTON | 4 | | MILTON ST | 4 | | POPLAR | 4 | | 1 BLOCK FROM PELLSTON GEN STOR | 2 | | 1014 N US 31 | 2 | | 1014 N. US31 | 2 | | 10998 RIGGSVILLE RD | 2 | | 11394 WHITE BIRCH DR | 2 | | 114 ZIPF ST | 2 | | 1145 W VAN RD | 2 | | 1147 RED SCHOOL RD | 2 | | 1212 KAZ RD | 2 |
| | | Fire incidents reported |
|---|
| Sreet name | Count |
|---|
| 1501 VAN RD | 2 | | 1509 S US31 | 2 | | 2309 PINE TRAIL RD | 2 | | 243 N LARKS LAKE RD | 2 | | 2475 N PLEASANTVIEW RD | 2 | | 2488 DEL RD | 2 | | 2490 N US 31 HWY | 2 | | 25 WRIGHT ST | 2 | | 287 N PLEASENTVIEW RD | 2 | | 2999 N US 31 HWY VAN RD | 2 | | 300 CANBY RD | 2 | | 3250 E VAN RD | 2 | | 3405 E VAN RD | 2 | | 368 TINDEL ST | 2 | | 3770 N US 31 | 2 | | 381 ZIPF ST | 2 | | 389 PLAINS RD E BRANCH RD | 2 | | 3948 E ROBINSON RD | 2 | | 3951 N LARKS LAKE RD | 2 | | 411 S DURKALIC RD | 2 | | 4546 E ROBBINSON RD | 2 | | 4690 N PLEASENTVIEW RD | 2 | | 5041 N PLEASANTVIEW RD | 2 | | 5483 E VAN RD | 2 | | 5744 E VAN RD | 2 |
|
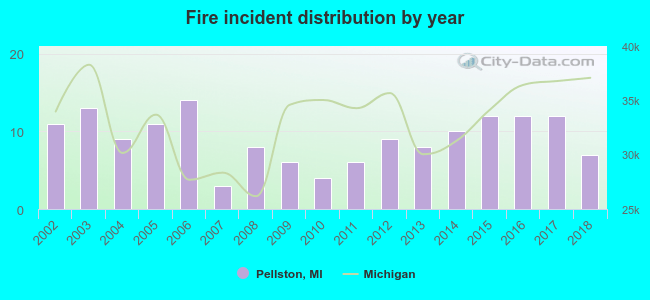 According to the data from the years 2002 - 2018 the average number of fires per year is 9. The highest number of reported fire incidents - 14 took place in 2006, and the least - 3 in 2007. The data has a decreasing trend.
 25.2% incidents where reported in the morning and 74.8% in the evening. The most fires (20.0%) took place on Wednesday, and the least (11.0%) on Thursday.
 According to the 155 incident reports from years 2002 - 2018 most fires (15.5%) took place during July, and the least (1.9%) in October.
 Out of all 818 cases reported during the years 2002 - 2018, the most belonged to the categories: Rescue & EMS (37.7%), Hazardous Condition (31.4%), and Fire (18.9%).
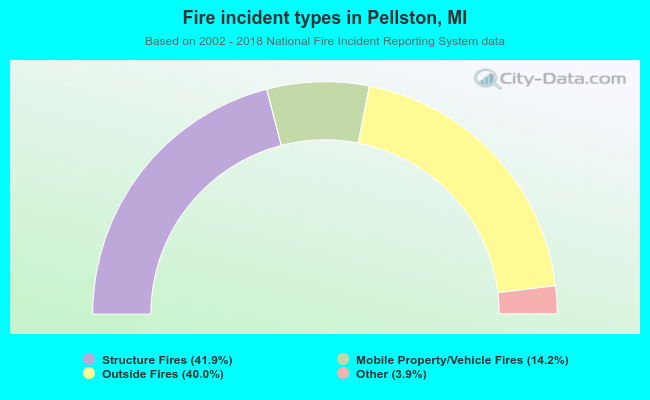 When looking into fire subcategories, the most incidents belonged to: Structure Fires (41.9%), and Outside Fires (40.0%).