Paynesville: Fire Incidents, Minnesota (MN)
Where are fire incidents reported in Paynesville, MN
Something went wrong! Please refresh the page.
|
| |||||||||||||||||||||||||||||||||||||||||||||||||||||||||||||||||||||||||||||||||||||||||||||||||||||||||||||
2002 - 2018 National Fire Incident Reporting System (NFIRS) incidents
- Incident types reported to NFIRS in Paynesville, MN
- 34441.6%Fire
- 20024.2%Rescue & EMS
- 11714.1%Hazardous Condition
- 809.7%False Alarm
- 607.3%Good Intent Call
- 232.8%Service Call
- 20.2%Special Incident
- 10.1%Overpressure Rupture
- Fire incident types reported to NFIRS in Paynesville, MN
- 13840.1%Structure Fires
- 12335.8%Outside Fires
- 7020.3%Mobile Property/Vehicle Fires
- 133.8%Other
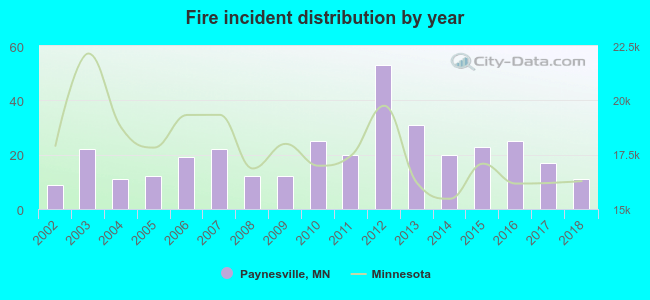 According to the data from the years 2002 - 2018 the average number of fires per year is 20. The highest number of reported fires - 53 took place in 2012, and the least - 9 in 2002. The data has an increasing trend.
 28.8% incidents where reported in the morning and 71.2% in the evening. The most fires (18.6%) took place on Saturday, and the least (11.0%) on Tuesday.
 According to the 344 reports from years 2002 - 2018 most fires (11.6%) took place during October, and the least (5.2%) in December.
 Out of all 827 cases reported during the years 2002 - 2018, the most belonged to the categories: Fire (41.6%), Rescue & EMS (24.2%), and Hazardous Condition (14.1%).
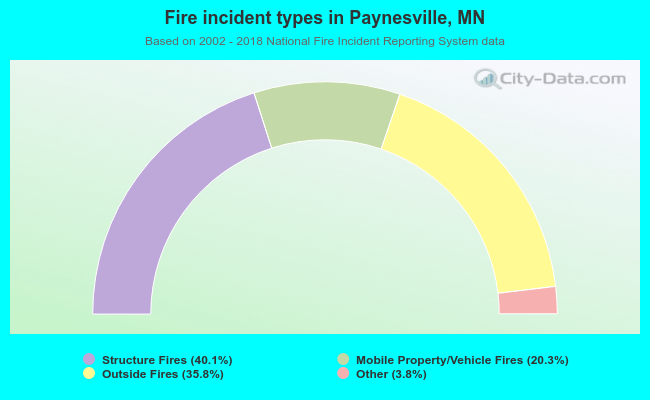 When looking into fire subcategories, the most incidents belonged to: Structure Fires (40.1%), and Outside Fires (35.8%).