Parsons: Fire Incidents, Kansas (KS)
Where are fire incidents reported in Parsons, KS
Something went wrong! Please refresh the page.
| Fire incidents reported | |
|---|---|
| Sreet name | Count |
| MAIN | 160 |
| CRAWFORD | 108 |
| STEVENS | 94 |
| APPLETON | 68 |
| WASHINGTON | 62 |
| CHESS | 60 |
| CLARK | 58 |
| BELMONT | 56 |
| CORNING | 56 |
| GABRIEL | 56 |
| GRAND | 56 |
| THIRTY SECOND | 54 |
| DIRR | 52 |
| BRIGGS | 50 |
| TWENTY FIRST | 50 |
| BROADWAY | 46 |
| HIGHWAY 59 | 46 |
| SIXTEENTH | 42 |
| MORTON | 32 |
| TWENTY SIXTH | 32 |
| QUEENS RD | 30 |
| THIRTEENTH | 30 |
| TWENTY FIFTH | 30 |
| CENTRAL | 28 |
| 24000 RD | 24 |
| QUEENS RD. | 24 |
| TWENTY NINTH | 24 |
| 22000 RD | 22 |
| 24000 RD. | 22 |
| THORNTON | 22 |
| Other | 154 |
2002 - 2018 National Fire Incident Reporting System (NFIRS) incidents
- Incident types reported to NFIRS in Parsons, KS
- 2,48838.7%Rescue & EMS
- 1,64825.6%Fire
- 1,33820.8%Hazardous Condition
- 4006.2%Good Intent Call
- 2604.0%Service Call
- 2533.9%False Alarm
- 200.3%Overpressure Rupture
- 180.3%Severe Weather
- Fire incident types reported to NFIRS in Parsons, KS
- 68441.5%Structure Fires
- 67541.0%Outside Fires
- 26215.9%Mobile Property/Vehicle Fires
- 271.6%Other
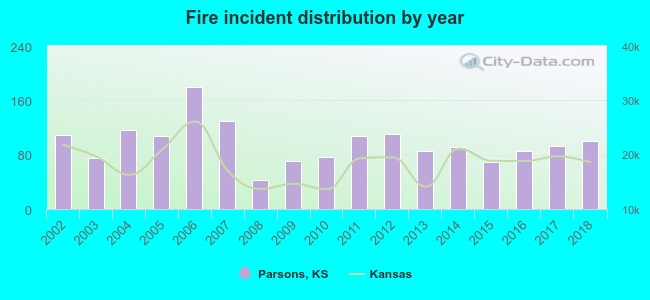 Based on the data from the years 2002 - 2018 the average number of fire incidents per year is 97. The highest number of reported fire incidents - 179 took place in 2006, and the least - 42 in 2008. The data has a dropping trend.
The average number of yearly fire incidents per 10k residents in Parsons, KS compared to nearest cities:
(Note: Based on data for the last 3 years, including only cities with population 5,000 and above)
| Parsons: | 91.1 |
| Independence: | 132.4 |
| Chanute: | 98.3 |
| Coffeyville: | 129.3 |
| Pittsburg: | 99.9 |
| Iola: | 111.7 |
 The median response time based on all reported fire incidents is 6 minutes. This is close to the Kansas median value.
The median response time in Parsons, KS compared to nearest cities:
(Note: Based on data for all years, including only cities with at least 500 fire incidents)
| Parsons: | 6 minutes |
| Cherryvale: | 7 minutes |
| Chetopa: | 6 minutes |
| Neodesha: | 5 minutes |
| Independence: | 5 minutes |
| Chanute: | 6 minutes |
| Columbus: | 10 minutes |
| Coffeyville: | 5 minutes |
| Pittsburg: | 3 minutes |
 According to the reports from the years 2002 - 2018 the average number of fire-related fatalities per year is 0. The highest number of deaths - 2 took place in 2004, and the lowest - 0 in 2002. The data has a constant trend.
 Based on the data from the years 2002 - 2018 the average number of fire-related casualties per year is 1. The highest number of reported casualties - 4 took place in 2005, and the lowest - 0 in 2004. The data has a growing trend.
The average number of casualties per 1,000 fire incidents is 9. This indicator was the highest - 37 in 2005, and the lowest 0 in 2004. The trend for casualties per 1,000 fires is growing. Compared to the state value the number of injuries per 1,000 fire incidents is about the same.
Based on the data from the years 2002 - 2018 the average number of fire-related casualties per year is 1. The highest number of reported casualties - 4 took place in 2005, and the lowest - 0 in 2004. The data has a growing trend.
The average number of casualties per 1,000 fire incidents is 9. This indicator was the highest - 37 in 2005, and the lowest 0 in 2004. The trend for casualties per 1,000 fires is growing. Compared to the state value the number of injuries per 1,000 fire incidents is about the same.Casualties per 1,000 incidents in Parsons, KS compared to nearest cities:
(Note: Based on data for all years, including only cities with at least 500 fire incidents)
| Parsons: | 9.1 |
| Cherryvale: | 3.5 |
| Chetopa: | 0.0 |
| Neodesha: | 12.3 |
| Independence: | 15.4 |
| Chanute: | 11.8 |
| Columbus: | 0.5 |
| Coffeyville: | 9.1 |
| Pittsburg: | 8.4 |
 35.0% incidents where reported in the morning and 65.0% in the evening. The most fires (17.5%) took place on Saturday, and the least (12.6%) on Monday.
 According to the 1,648 incident reports from years 2002 - 2018 most fires (12.1%) took place during March, and the least (5.2%) in May.
 Out of all 6,431 cases reported during the years 2002 - 2018, the most belonged to the categories: Rescue & EMS (38.7%), Fire (25.6%), and Hazardous Condition (20.8%).
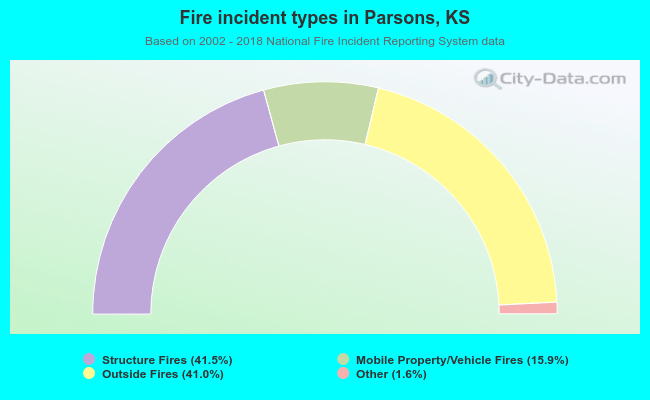 When looking into fire subcategories, the most reports belonged to: Structure Fires (41.5%), and Outside Fires (41.0%).