| Fire incidents reported |
|---|
| Sreet name | Count |
|---|
| I-15 | 12 | | GAP ROAD | 6 | | I-15 FWY | 6 | | 100 EAST 47 SOUTH ST | 4 | | 100 W 2700 N | 4 | | 160 W 300 S | 4 | | 269 E 400 N | 4 | | 383 W 300 S | 4 | | INTERSTATE I 15 | 4 | | MP 75 I15 | 4 | | NORTH HILLS | 4 | | OLD 91 | 4 | | 100 E. 47 S. | 2 | | 100 N 500 W | 2 | | 100 NORTH 600 WEST | 2 | | 100 SOUTH 100 WEST ST | 2 | | 100 SOUTH 3700 WEST ST | 2 | | 100 SOUTH MAIN | 2 | | 100 W 200 S | 2 | | 100 W. 100 N. | 2 | | 100 WEST 700 NORTH LGTS | 2 | | 1100 N. 300 W. | 2 | | 115 N 825 W | 2 | | 1200 W 2800 N | 2 | | 1214 OLD HIGHWAY 91 | 2 |
| | | Fire incidents reported |
|---|
| Sreet name | Count |
|---|
| 1214 W OLD HIGHWAY 91 | 2 | | 1220 WEST 200 SOUTH | 2 | | 124 S. 300 EAST | 2 | | 125 SOUTH 100 WEST RD | 2 | | 1300 W 200 S LGTS | 2 | | 1335 WEST 200 SOUTH | 2 | | 138 W 400 N | 2 | | 1400 N 1600 W | 2 | | 1400 W 1000 N | 2 | | 1400 WEST LGTS | 2 | | 143 HWY | 2 | | 143 STATE ROAD HWY | 2 | | 1435 WEST 200 SOUTH | 2 | | 145 N 600 W | 2 | | 145 NORTH 600 WEST | 2 | | 1480 W 200 S | 2 | | 149 W OLD 91 HWY | 2 | | 15 MILES UP SUMMIT CANYON | 2 | | 150 NORTH 750 WEST | 2 | | 1530 N. 1050 WEST | 2 | | 1535 W 200 S | 2 | | 155 N. 600W. RD | 2 | | 160 N MAIN | 2 | | 165 S 600 W | 2 | | |
|
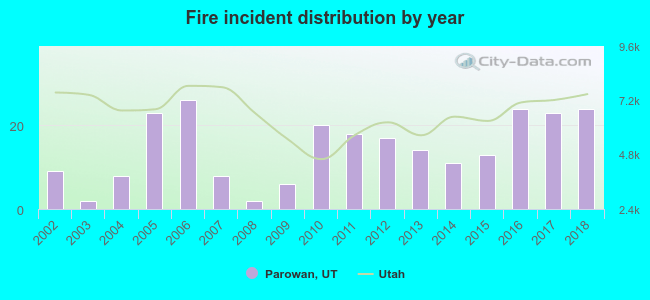 Based on the data from the years 2002 - 2018 the average number of fires per year is 15. The highest number of reported fires - 26 took place in 2006, and the least - 2 in 2003. The data has a growing trend.
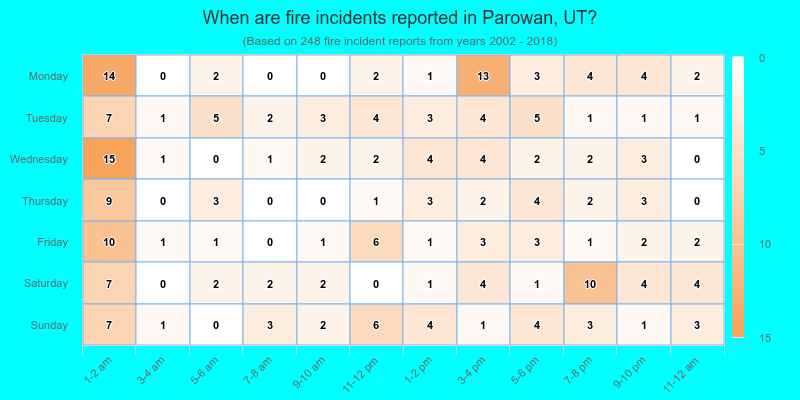
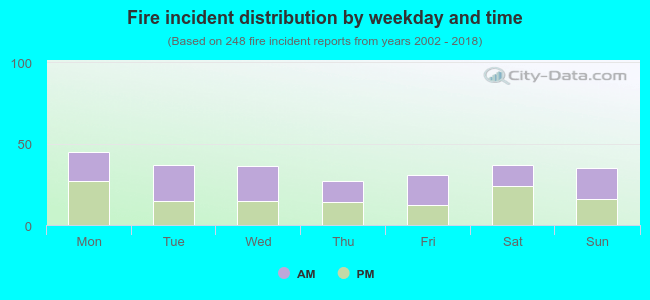 50.4% incidents where reported in the morning and 49.6% in the evening. The most fires (18.1%) took place on Monday, and the least (10.9%) on Thursday.
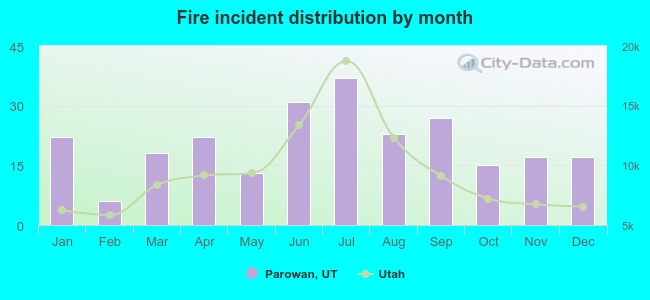 According to the 248 fire incident reports from years 2002 - 2018 most fires (14.9%) took place during July, and the least (2.4%) in February.
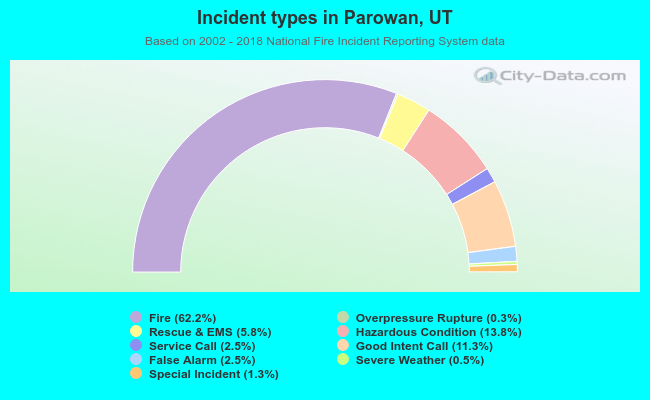 Out of all 399 cases reported during the years 2002 - 2018, the most belonged to the categories: Fire (62.2%), Hazardous Condition (13.8%), and Good Intent Call (11.3%).
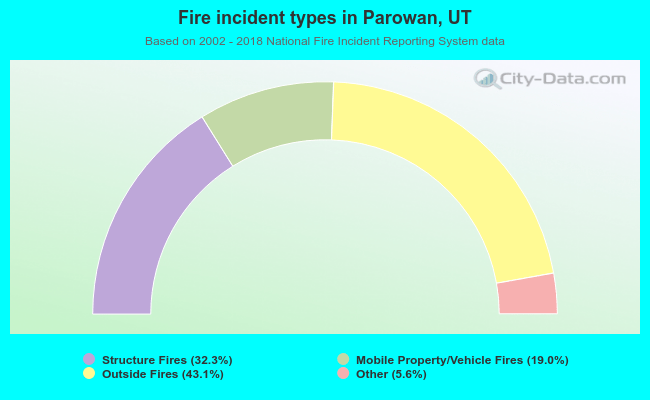 When looking into fire subcategories, the most reports belonged to: Outside Fires (43.1%), and Structure Fires (32.3%).