Paris: Fire Incidents, Illinois (IL)
Where are fire incidents reported in Paris, IL
Something went wrong! Please refresh the page.
| Fire incidents reported | |
|---|---|
| Sreet name | Count |
| MAIN ST | 162 |
| CENTRAL AVE | 104 |
| COURT ST | 76 |
| MADISON ST | 68 |
| CHERRY POINT RD | 56 |
| IL HWY 1 | 54 |
| WEST END AVE | 54 |
| CRAWFORD ST | 42 |
| TERRE HAUTE RD | 38 |
| JASPER ST | 36 |
| CLINTON RD | 34 |
| IL HWY 16 | 34 |
| WASHINGTON ST | 34 |
| US HWY 150 | 32 |
| IL HWY 133 | 30 |
| 925TH ST | 28 |
| WOOD ST | 28 |
| DOUGLAS ST | 26 |
| EDGAR ST | 26 |
| UNION ST | 26 |
| AUSTIN ST | 24 |
| BLACKBURN ST | 24 |
| JEFFERSON ST | 24 |
| MARSHALL ST | 24 |
| VAN BUREN ST | 24 |
| NEWTON ST | 22 |
| 400TH RD | 20 |
| SPRINGFIELD AVE | 20 |
| VANCE AVE | 20 |
| 1900TH ST | 18 |
| Other | 297 |
2002 - 2018 National Fire Incident Reporting System (NFIRS) incidents
- Incident types reported to NFIRS in Paris, IL
- 1,50531.1%Fire
- 1,37128.3%Rescue & EMS
- 84917.5%Hazardous Condition
- 49210.2%Good Intent Call
- 3817.9%False Alarm
- 1713.5%Service Call
- 350.7%Severe Weather
- 240.5%Special Incident
- 130.3%Overpressure Rupture
- Fire incident types reported to NFIRS in Paris, IL
- 62241.3%Outside Fires
- 54736.3%Structure Fires
- 23015.3%Mobile Property/Vehicle Fires
- 1067.0%Other
 Based on the data from the years 2002 - 2018 the average number of fire incidents per year is 89. The highest number of fire incidents - 117 took place in 2010, and the least - 60 in 2018. The data has a declining trend.
The average number of yearly fire incidents per 10k residents in Paris, IL compared to nearest cities:
(Note: Based on data for the last 3 years, including only cities with population 5,000 and above)
| Paris: | 82.0 |
| Charleston: | 54.2 |
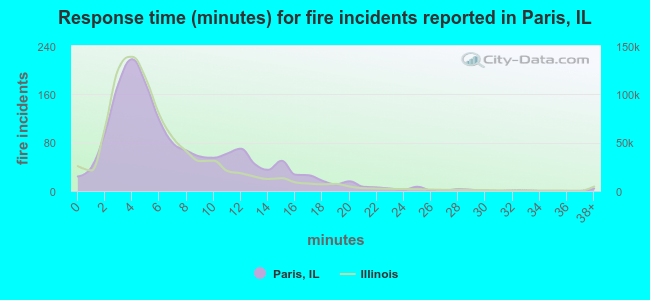 The median response time based on all reported fire incidents is 6 minutes. This is about the same as the state median value.
The median response time in Paris, IL compared to nearest cities:
(Note: Based on data for all years, including only cities with at least 500 fire incidents)
| Paris: | 6 minutes |
| Marshall: | 9 minutes |
| Georgetown: | 10 minutes |
| Charleston: | 3 minutes |
| Westville: | 10 minutes |
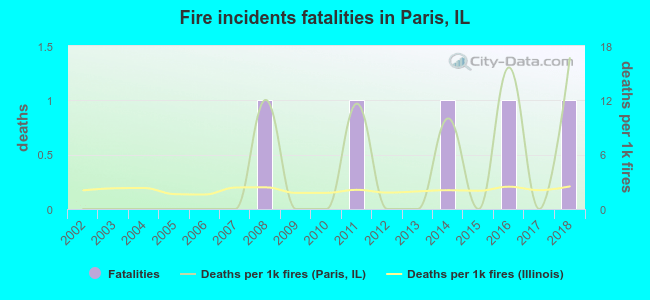 Based on the reports from the years 2002 - 2018 the average number of fire-related fatalities per year is 0. The highest number of reported deaths - 1 took place in 2008, and the lowest - 0 in 2002. The data has an increasing trend.
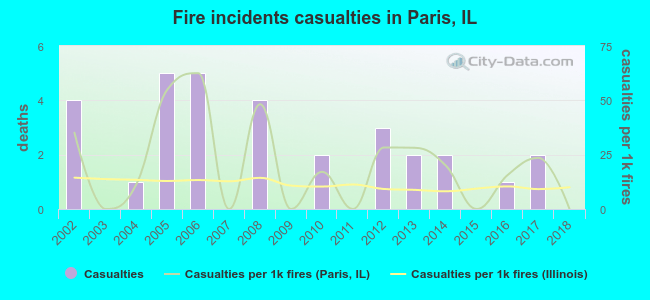 Based on the data from the years 2002 - 2018 the average number of fire-related yearly casualties is 2. The highest number of injuries - 5 took place in 2005, and the lowest - 0 in 2003. The data has a decreasing trend.
The average number of casualties per 1,000 fire incidents is 20. This indicator was the highest - 63 in 2006, and the lowest 0 in 2003. The trend for casualties per 1,000 fire incidents is decreasing. Compared to the Illinois value the number of injuries per 1,000 fires is higher.
Based on the data from the years 2002 - 2018 the average number of fire-related yearly casualties is 2. The highest number of injuries - 5 took place in 2005, and the lowest - 0 in 2003. The data has a decreasing trend.
The average number of casualties per 1,000 fire incidents is 20. This indicator was the highest - 63 in 2006, and the lowest 0 in 2003. The trend for casualties per 1,000 fire incidents is decreasing. Compared to the Illinois value the number of injuries per 1,000 fires is higher.Casualties per 1,000 incidents in Paris, IL compared to nearest cities:
(Note: Based on data for all years, including only cities with at least 500 fire incidents)
| Paris: | 20.6 |
| Marshall: | 5.1 |
| Georgetown: | 0.0 |
| Charleston: | 17.3 |
| Westville: | 15.7 |
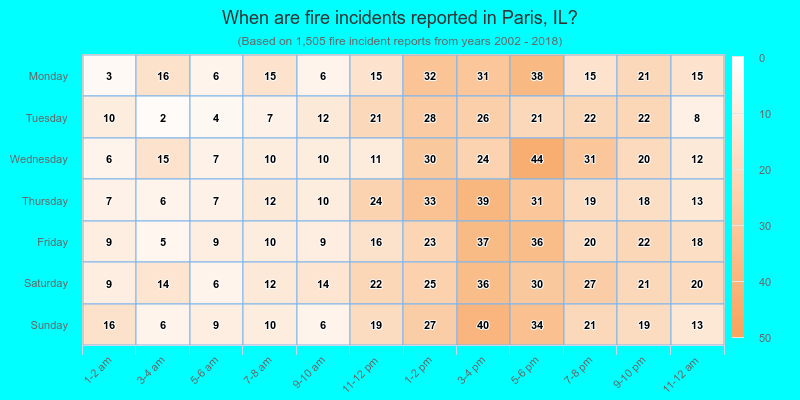
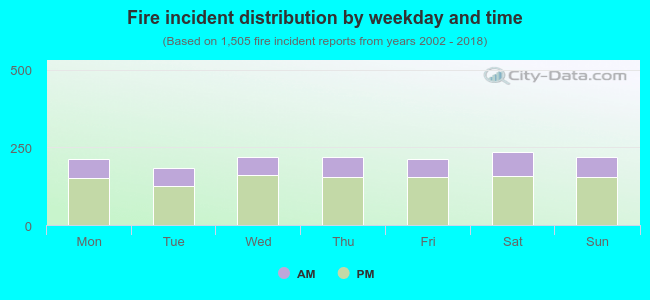 29.4% incidents where reported in the morning and 70.6% in the evening. The most fires (15.7%) took place on Saturday, and the least (12.2%) on Tuesday.
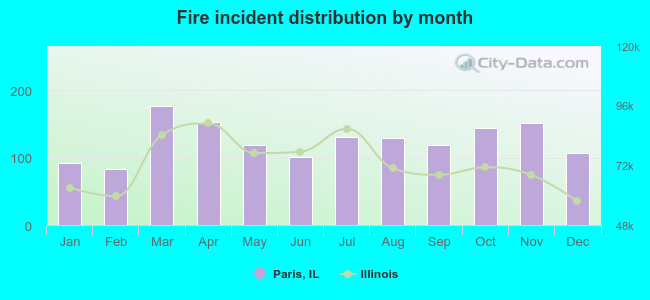 Based on the 1,505 fires from years 2002 - 2018 most fires (11.8%) took place during March, and the least (5.5%) in February.
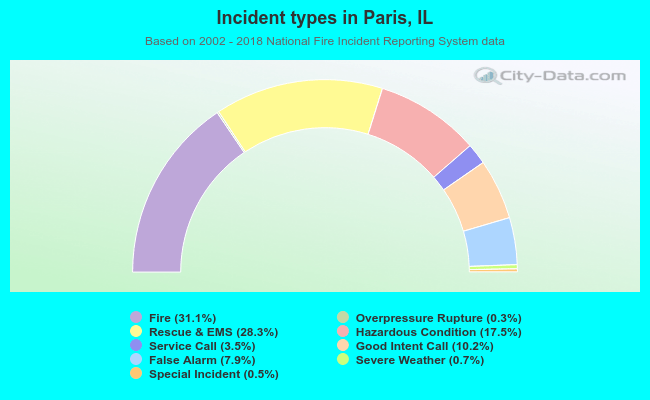 Out of all 4,841 cases reported during the years 2002 - 2018, the most belonged to the categories: Fire (31.1%), Rescue & EMS (28.3%), and Hazardous Condition (17.5%).
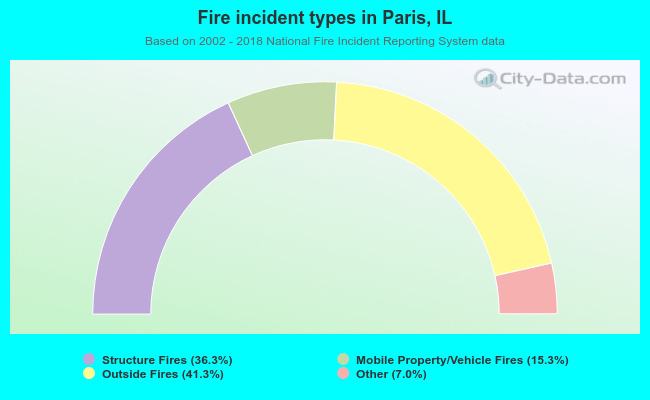 When looking into fire subcategories, the most incidents belonged to: Outside Fires (41.3%), and Structure Fires (36.3%).