Paoli: Fire Incidents, Pennsylvania (PA)
Where are fire incidents reported in Paoli, PA
Something went wrong! Please refresh the page.
|
| |||||||||||||||||||||||||||||||||||||||||||||||||||||||||||||||||||||||||||||||||||||||||||||||||||||||||||||
2003 - 2018 National Fire Incident Reporting System (NFIRS) incidents
- Incident types reported to NFIRS in Paoli, PA
- 33228.9%Hazardous Condition
- 30026.1%False Alarm
- 27624.0%Fire
- 1109.6%Rescue & EMS
- 857.4%Good Intent Call
- 403.5%Service Call
- 60.5%Overpressure Rupture
- Fire incident types reported to NFIRS in Paoli, PA
- 13749.6%Structure Fires
- 10136.6%Outside Fires
- 269.4%Mobile Property/Vehicle Fires
- 124.3%Other
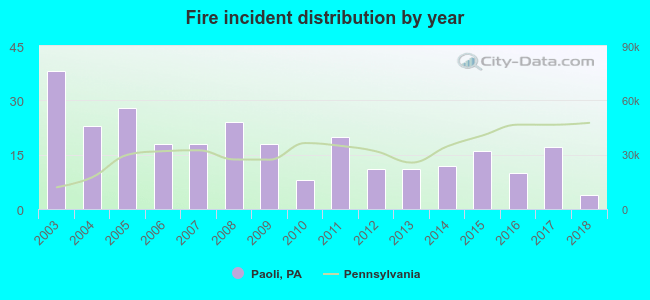 According to the data from the years 2003 - 2018 the average number of fire incidents per year is 17. The highest number of reported fire incidents - 38 took place in 2003, and the least - 4 in 2018. The data has a dropping trend.
The average number of yearly fire incidents per 10k residents in Paoli, PA compared to nearest cities:
(Note: Based on data for the last 3 years, including only cities with population 5,000 and above)
| Paoli: | 18.5 |
| Phoenixville: | 65.7 |
| King of Prussia: | 82.4 |
| Audubon: | 30.8 |
| West Chester: | 56.6 |
| West Norriton: | 4.1 |
| Broomall: | 53.4 |
| Trooper: | 7.5 |
| Norristown: | 98.0 |

 34.1% incidents where reported in the morning and 65.9% in the evening. The most fires (17.0%) took place on Wednesday, and the least (10.5%) on Sunday.
 According to the 276 fire incident reports from years 2003 - 2018 most fires (15.2%) took place during January, and the least (3.3%) in October.
 Out of all 1,150 cases reported during the years 2003 - 2018, the most belonged to the categories: Hazardous Condition (28.9%), False Alarm (26.1%), and Fire (24.0%).
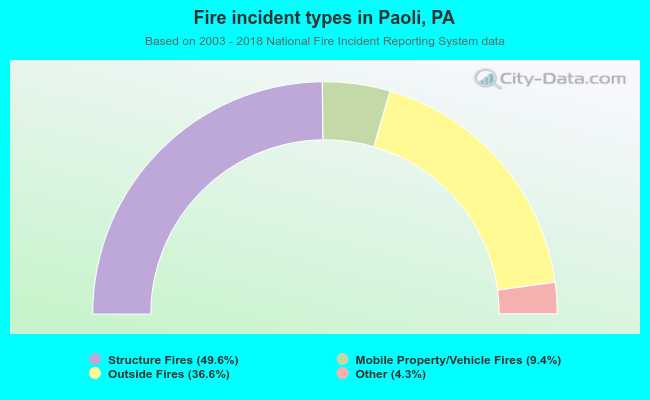 When looking into fire subcategories, the most reports belonged to: Structure Fires (49.6%), and Outside Fires (36.6%).