Pantego: Fire Incidents, Texas (TX)
Where are fire incidents reported in Pantego, TX
Something went wrong! Please refresh the page.
|
| |||||||||||||||||||||||||||||||||||||||||||||||||||||||||||||||||||||||||||||||||||||||||||||||||||||||||||||
2003 - 2018 National Fire Incident Reporting System (NFIRS) incidents
- Incident types reported to NFIRS in Pantego, TX
- 1,73253.8%Rescue & EMS
- 58418.1%Service Call
- 33410.4%Hazardous Condition
- 2678.3%Good Intent Call
- 1564.8%Fire
- 1394.3%False Alarm
- Fire incident types reported to NFIRS in Pantego, TX
- 5736.5%Structure Fires
- 5233.3%Outside Fires
- 3321.2%Mobile Property/Vehicle Fires
- 149.0%Other
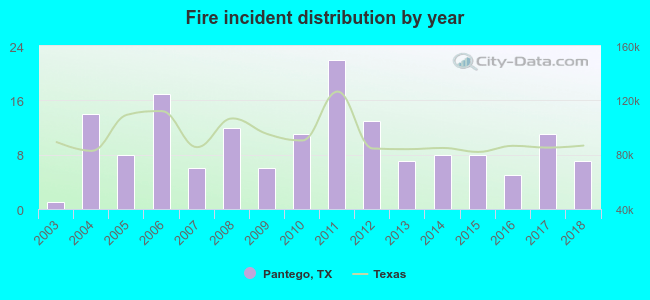 According to the data from the years 2003 - 2018 the average number of fire incidents per year is 10. The highest number of reported fires - 22 took place in 2011, and the least - 1 in 2003. The data has a rising trend.
 26.9% incidents where reported in the morning and 73.1% in the evening. The most fires (19.9%) took place on Monday, and the least (10.3%) on Tuesday.
 Based on the 156 reports from years 2003 - 2018 most fires (12.2%) took place during April, and the least (4.5%) in October.
 Out of all 3,218 cases reported during the years 2003 - 2018, the most belonged to the categories: Rescue & EMS (53.8%), Service Call (18.1%), and Hazardous Condition (10.4%).
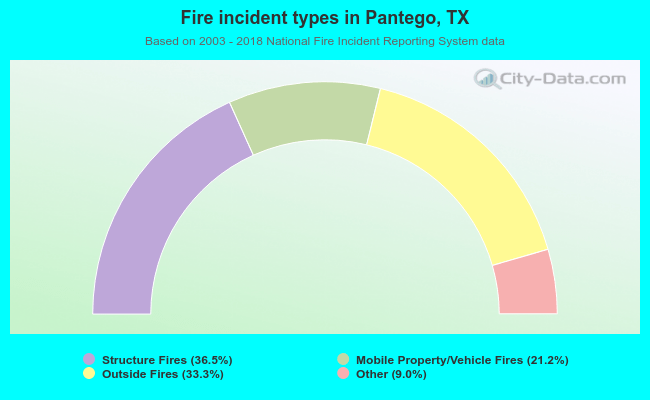 When looking into fire subcategories, the most reports belonged to: Structure Fires (36.5%), and Outside Fires (33.3%).