| Fire incidents reported |
|---|
| Sreet name | Count |
|---|
| 105 NORTH 700 WEST | 18 | | 165 SOUTH 700 WEST | 4 | | HIGHWAY 12 | 4 | | MILE POST 10 ON SR 20 | 4 | | MILE POST 147 ON US 89 | 4 | | RIVER LANE ROAD | 4 | | US 89 | 4 | | 100 EAST 300 SOUTH | 2 | | 1010 SOUTH 100EAST | 2 | | 1026 NORTH 700 WEST | 2 | | 103 EAST BLUE MEADOW LN | 2 | | 105 SOUTH 700 WEST | 2 | | 1100 SOUTH SR 143 HWY | 2 | | 115 NORTH 300 WEST | 2 | | 117 SOUTH MAIN | 2 | | 125 SOUTH 800 WEST | 2 | | 127 EAST US 89 | 2 | | 1381 EAST 1800 NORT | 2 | | 1420 NORTH RIVER LANE RD | 2 | | 150 EAST 100 SOUTH | 2 | | 150 NORTH MAIN | 2 | | 150 WEST 400 NORTH | 2 | | 1525 NORTH 475 WEST | 2 | | 160 SOUTH MAIN | 2 | | 160 SOUTH MAIN | 2 |
| | | Fire incidents reported |
|---|
| Sreet name | Count |
|---|
| 160 WEST 200 SOUTH LGTS | 2 | | 18 EAST 980 SOUTH | 2 | | 1885 NORTH RIVERLANE | 2 | | 189 WEST 200 SOUTH | 2 | | 200 NORTH 55 WEST | 2 | | 205 NORTH 300 WEST | 2 | | 220 SOUTH 100 EAST | 2 | | 220 WEST 500 SOUTH | 2 | | 2338 NORTH US 89 | 2 | | 236 SOUTH 200 EAST | 2 | | 244 WEST CENTER | 2 | | 245 EAST 500 SOUTH | 2 | | 25 WEST 400 SOUTH | 2 | | 250 SOUTH 100 WEST | 2 | | 254 EAST CENTER | 2 | | 275 EAST 200 SOUTH | 2 | | 275 SOUTH 200 WEST | 2 | | 296 WEST 200 NORTH | 2 | | 2960 LAKESHORE DR HERCULES | 2 | | 30 WEST 200 SOUTH | 2 | | 325 WEST 200 SOUTH | 2 | | 357 EAST 200 NORTH | 2 | | 375 EAST 100 NORTH | 2 | | 375 NORTH 700 WEST | 2 | | |
|
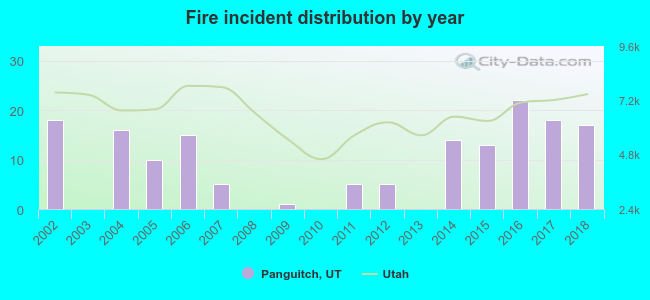 Based on the data from the years 2002 - 2018 the average number of fires per year is 9. The highest number of reported fires - 22 took place in 2016, and the least - 0 in 2003. The data has a dropping trend.
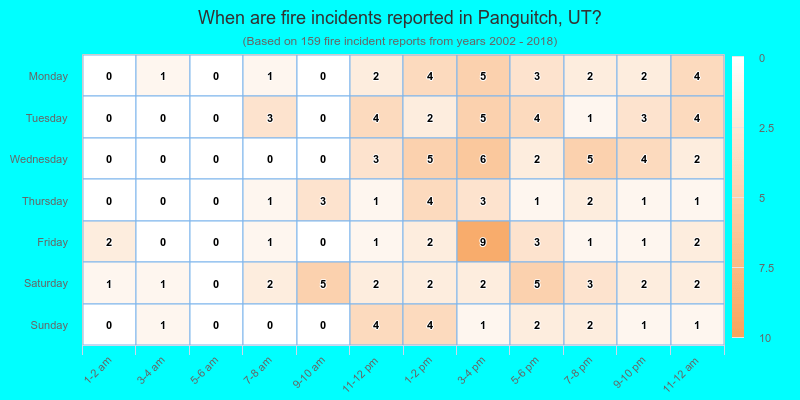
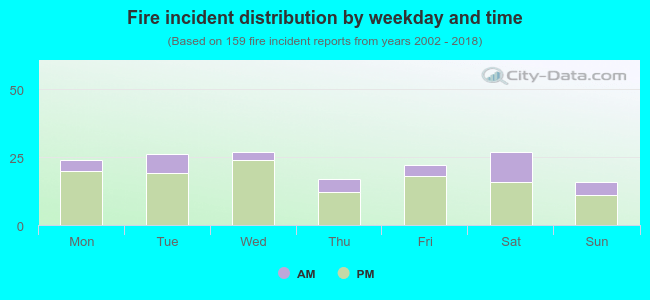 24.5% incidents where reported in the morning and 75.5% in the evening. The most fires (17.0%) took place on Wednesday, and the least (10.1%) on Sunday.
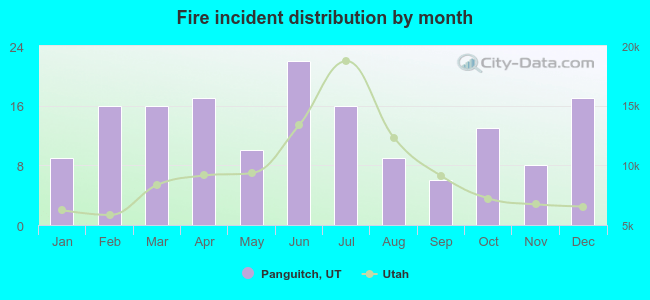 According to the 159 fire incident reports from years 2002 - 2018 most fires (13.8%) took place during June, and the least (3.8%) in September.
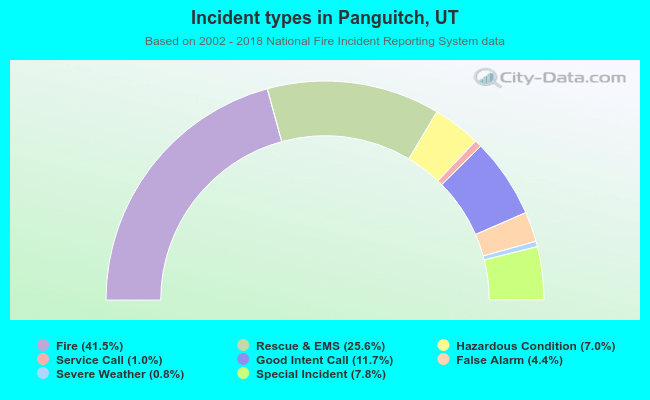 Out of all 383 cases reported during the years 2002 - 2018, the most belonged to the categories: Fire (41.5%), Overpressure Rupture (25.6%), and Service Call (11.7%).
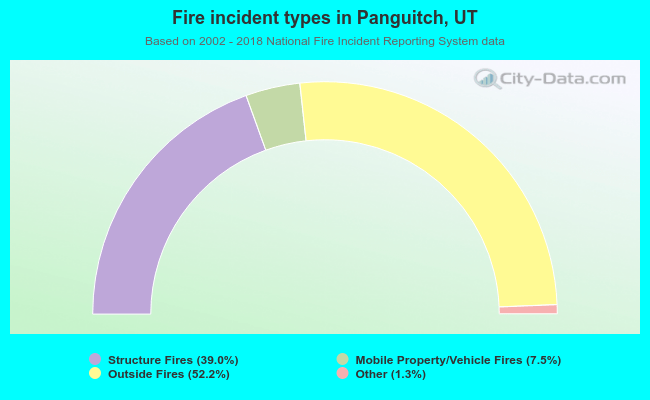 When looking into fire subcategories, the most reports belonged to: Outside Fires (52.2%), and Structure Fires (39.0%).