| Fire incidents reported |
|---|
| Sreet name | Count |
|---|
| MCJESTER RD | 30 | | PRINCE REAPER RD | 18 | | LITTLE RED MT RD | 14 | | MCJESTER RD | 14 | | HWY 16 | 12 | | CROW CUTOFF | 10 | | HWY 124 | 10 | | MC JESTER RD | 10 | | OLD RIVER RD | 10 | | ARMSTRONG RD | 8 | | HICKORY FLAT RD | 8 | | 1850 MCJESTER RD | 6 | | 203 AUSTIN ST | 6 | | FUTURE LN | 6 | | RIVERMIST DR | 6 | | 169 DEWEY RD | 4 | | 2ND ST | 4 | | 445 DEWEY RD | 4 | | BETTLY RD | 4 | | BOBBY REAPER RD | 4 | | BOTTORFF RD | 4 | | CHINKAPIN DR | 4 | | CRESTVIEW LN | 4 | | CRISLER LANE | 4 | | GREEN VALLEY LN | 4 |
| | | Fire incidents reported |
|---|
| Sreet name | Count |
|---|
| HICKORYFLAT RD | 4 | | HWY 124 EAST | 4 | | HWY 305 BRIDGE | 4 | | OLD RIVER RD | 4 | | RAINBOW DR | 4 | | SECOND ST | 4 | | THOMAS RD | 4 | | #4 HAY MEADOW | 2 | | 1 TRAMELL DRIVE | 2 | | 100 HWY 110 | 2 | | 1007 MONROE ST | 2 | | 1009 SECOND ST | 2 | | 1009 SECOND STREET | 2 | | 101 MT HOME DR | 2 | | 102 AUSTIN ST | 2 | | 102 BRAIRCREEK RD | 2 | | 105 G-MAR LN | 2 | | 105 MOUNTAIN HOME DRIVE | 2 | | 109 CHICKAPEN DR | 2 | | 109 SEARCY ST | 2 | | 110 AND MCJESTER RD | 2 | | 110 GEMAR DR | 2 | | 110 MT HOME DR | 2 | | 110 MT SIDE DR | 2 | | 1100 SHORT ST | 2 |
|
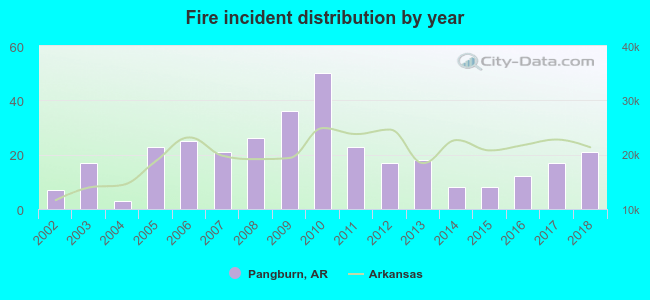 According to the data from the years 2002 - 2018 the average number of fire incidents per year is 20. The highest number of fire incidents - 50 took place in 2010, and the least - 3 in 2004. The data has a rising trend.
 23.2% incidents where reported in the morning and 76.8% in the evening. The most fires (19.6%) took place on Saturday, and the least (10.2%) on Thursday.
 Based on the 332 fire incidents from years 2002 - 2018 most fires (16.0%) took place during January, and the least (3.3%) in June.
 Out of all 523 cases reported during the years 2002 - 2018, the most belonged to the categories: Fire (63.5%), Overpressure Rupture (25.8%), and Rescue & EMS (3.8%).
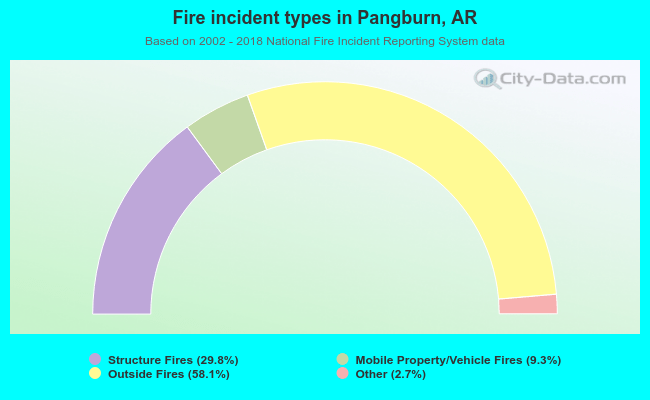 When looking into fire subcategories, the most incidents belonged to: Outside Fires (58.1%), and Structure Fires (29.8%).