Palo Pinto: Fire Incidents, Texas (TX)
Where are fire incidents reported in Palo Pinto, TX
Something went wrong! Please refresh the page.
|
| |||||||||||||||||||||||||||||||||||||||||||||||||||||||||||||||||||||||||||||||||||||||||||||||||||||||||||||
| Other | 40 | |||||||||||||||||||||||||||||||||||||||||||||||||||||||||||||||||||||||||||||||||||||||||||||||||||||||||||||
2003 - 2018 National Fire Incident Reporting System (NFIRS) incidents
- Incident types reported to NFIRS in Palo Pinto, TX
- 43253.8%Fire
- 26533.0%Rescue & EMS
- 587.2%Good Intent Call
- 283.5%Hazardous Condition
- 91.1%Service Call
- 50.6%False Alarm
- 30.4%Special Incident
- 20.2%Severe Weather
- 10.1%Overpressure Rupture
- Fire incident types reported to NFIRS in Palo Pinto, TX
- 33878.2%Outside Fires
- 5011.6%Structure Fires
- 235.3%Mobile Property/Vehicle Fires
- 214.9%Other
 According to the data from the years 2003 - 2018 the average number of fire incidents per year is 27. The highest number of reported fires - 83 took place in 2018, and the least - 1 in 2004. The data has a rising trend.
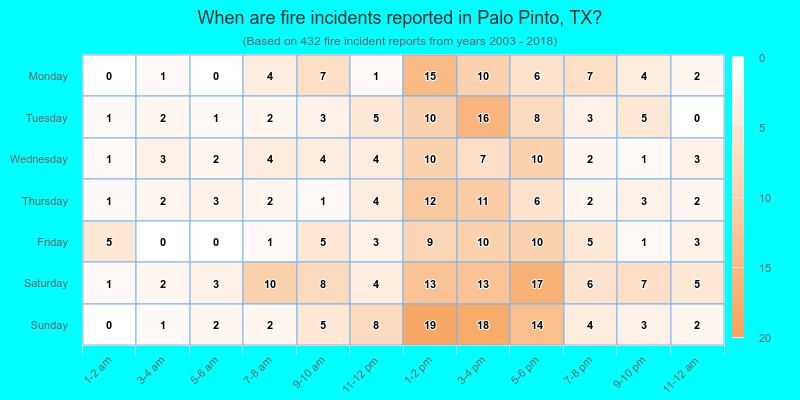
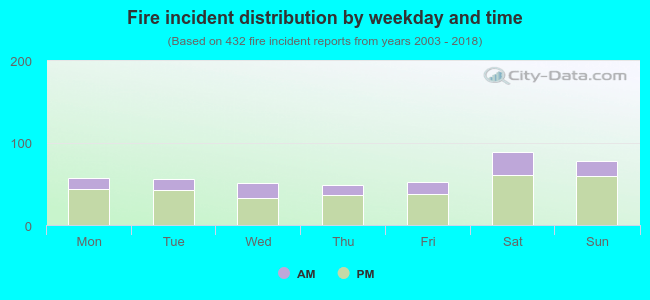 27.3% incidents where reported in the morning and 72.7% in the evening. The most fires (20.6%) took place on Saturday, and the least (11.3%) on Thursday.
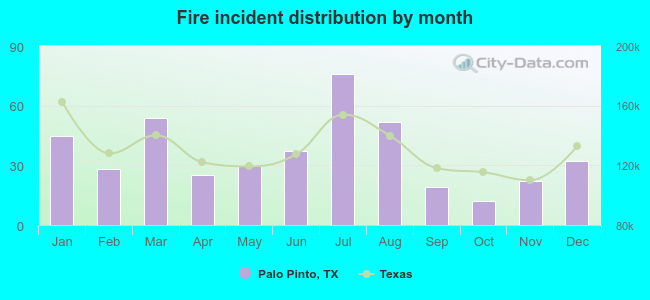 Based on the 432 reports from years 2003 - 2018 most fires (17.6%) took place during July, and the least (2.8%) in October.
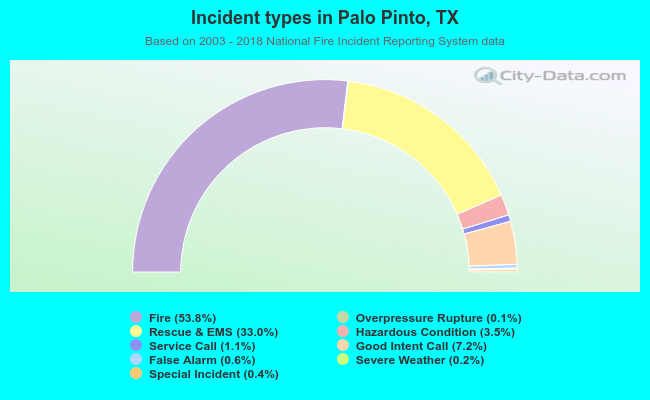 Out of all 803 cases reported during the years 2003 - 2018, the most belonged to the categories: Fire (53.8%), Rescue & EMS (33.0%), and Good Intent Call (7.2%).
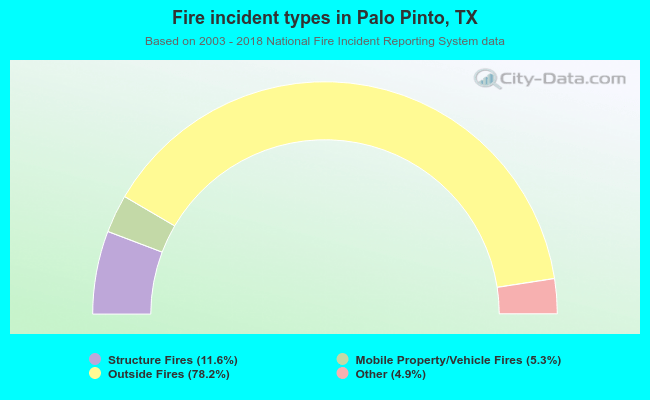 When looking into fire subcategories, the most reports belonged to: Outside Fires (78.2%), and Structure Fires (11.6%).