| Fire incidents reported |
|---|
| Sreet name | Count |
|---|
| MAYO TRL | 22 | | BROADWAY ST | 16 | | RT. 321 | 14 | | BROADWAY | 12 | | GREENTOWN LOOP | 10 | | MAYO PLAZA | 10 | | MILL BRANCH RD | 8 | | MILL STREET | 8 | | RT 321 | 8 | | CHESSIE LANE | 6 | | EUCLID AVE | 6 | | EUCLID AVE | 6 | | FM STAFFORD AVE | 6 | | 413 MADISON AVE | 4 | | 7TH ST | 4 | | 8TH ST | 4 | | BROADWAY AVE | 4 | | COURT ST | 4 | | FOREST PARK LN | 4 | | FRANK ST | 4 | | KENTUCKY ROUTE 581 | 4 | | KY 581 SALSBERRY JUNK YARD | 4 | | KY RT 581 | 4 | | MAIN ST | 4 | | MAYO PLZ | 4 |
| | | Fire incidents reported |
|---|
| Sreet name | Count |
|---|
| MILL ST | 4 | | NORTH MAYO TRAIL | 4 | | PONDEROSA DR. | 4 | | RIVER ROAD | 4 | | RT. 40 | 4 | | THIRD ST | 4 | | US 321 | 4 | | 101EUCLID AVE. | 2 | | 1039 KENTUCKY ROUTE 230 | 2 | | 10465 RT 825 | 2 | | 1120 SHORT STREET | 2 | | 113 UPPER STREET | 2 | | 1132 STATE STREET | 2 | | 150 MILL BR. RD. | 2 | | 1701 EUCLID AVE | 2 | | 182 SOUTHSIDE LANE | 2 | | 202 BROADWAY | 2 | | 204 DEPOT ROAD | 2 | | 219 BROADWAY | 2 | | 227 HIDDEN VALLEY ROAD | 2 | | 235 PINE ST | 2 | | 237 COURT ST. | 2 | | 255 HIDDEN VALLEY | 2 | | 258 FRANK ST | 2 | | 2647 KY ROUTE 1107 | 2 |
|
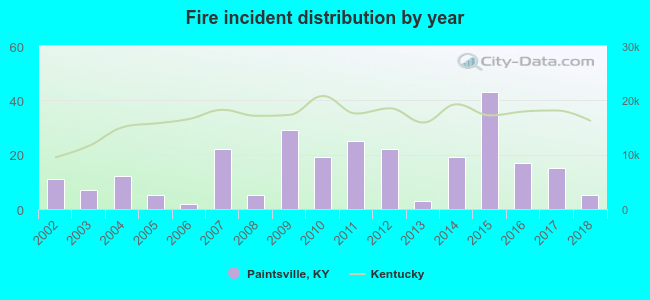 According to the data from the years 2002 - 2018 the average number of fire incidents per year is 15. The highest number of fire incidents - 43 took place in 2015, and the least - 2 in 2006. The data has a declining trend.
 31.4% incidents where reported in the morning and 68.6% in the evening. The most fires (17.6%) took place on Friday, and the least (9.6%) on Wednesday.
 According to the 261 reports from years 2002 - 2018 most fires (12.3%) took place during April, and the least (4.6%) in August.
 Out of all 5,609 cases reported during the years 2002 - 2018, the most belonged to the categories: Rescue & EMS (63.7%), Hazardous Condition (16.9%), and False Alarm (5.8%).
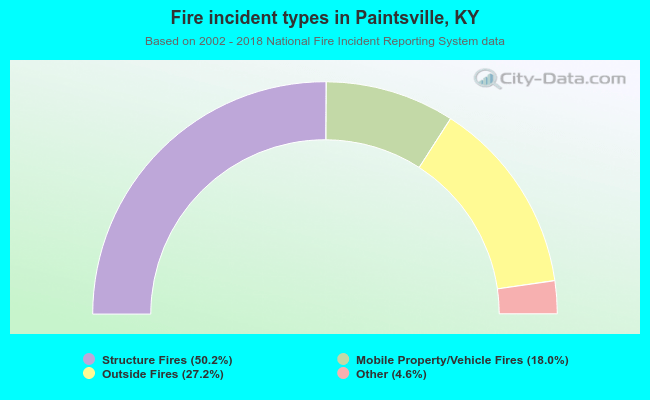 When looking into fire subcategories, the most incidents belonged to: Structure Fires (50.2%), and Outside Fires (27.2%).