Page: Fire Incidents, Arizona (AZ)
Where are fire incidents reported in Page, AZ
Something went wrong! Please refresh the page.
|
| |||||||||||||||||||||||||||||||||||||||||||||||||||||||||||||||||||||||||||||||||||||||||||||||||||||||||||||
2006 - 2018 National Fire Incident Reporting System (NFIRS) incidents
- Incident types reported to NFIRS in Page, AZ
- 9,27555.2%Hazardous Condition
- 4,65827.7%Rescue & EMS
- 1,81710.8%Service Call
- 5303.2%Good Intent Call
- 2551.5%Fire
- 2491.5%False Alarm
- 180.1%Special Incident
- Fire incident types reported to NFIRS in Page, AZ
- 9537.3%Structure Fires
- 9436.9%Outside Fires
- 4818.8%Mobile Property/Vehicle Fires
- 187.1%Other
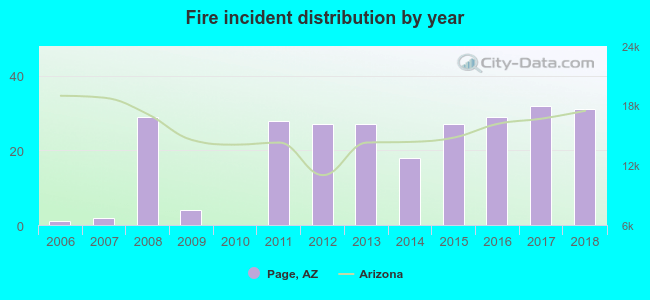 Based on the data from the years 2006 - 2018 the average number of fire incidents per year is 20. The highest number of fires - 32 took place in 2017, and the least - 0 in 2010. The data has a rising trend.
The average number of yearly fire incidents per 10k residents in Page, AZ compared to nearest cities:
(Note: Based on data for the last 3 years, including only cities with population 5,000 and above)
| Page: | 41.2 |
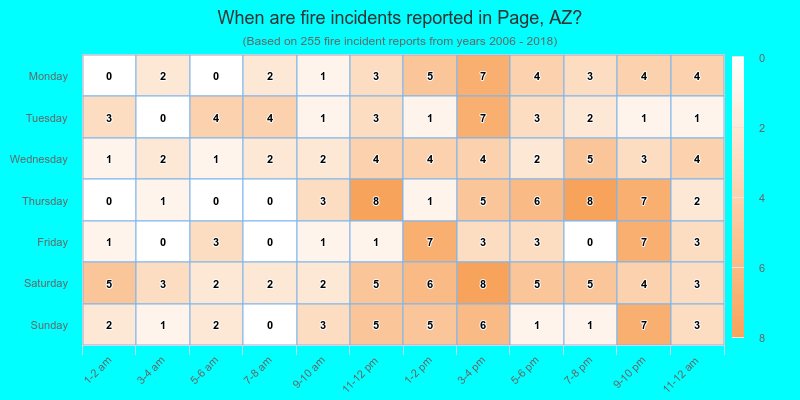
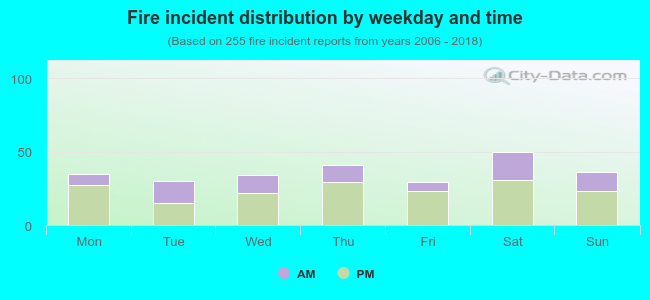 33.3% incidents where reported in the morning and 66.7% in the evening. The most fires (19.6%) took place on Saturday, and the least (11.4%) on Friday.
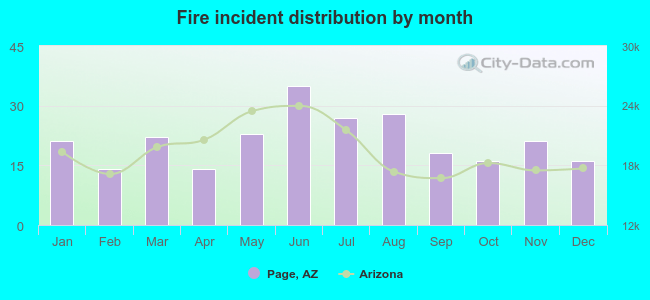 Based on the 255 reports from years 2006 - 2018 most fires (13.7%) took place during June, and the least (5.5%) in February.
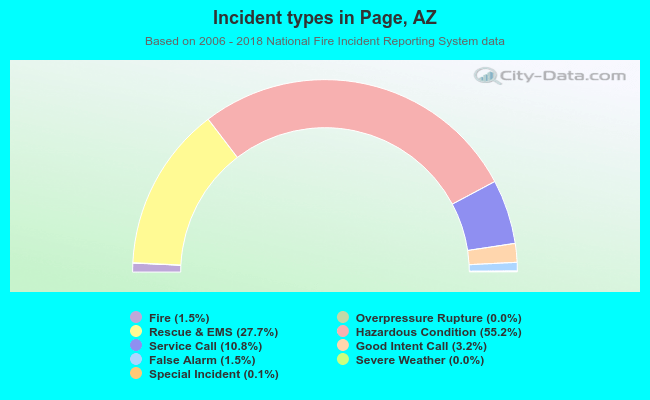 Out of all 16,807 cases reported during the years 2006 - 2018, the most belonged to the categories: Hazardous Condition (55.2%), Rescue & EMS (27.7%), and Service Call (10.8%).
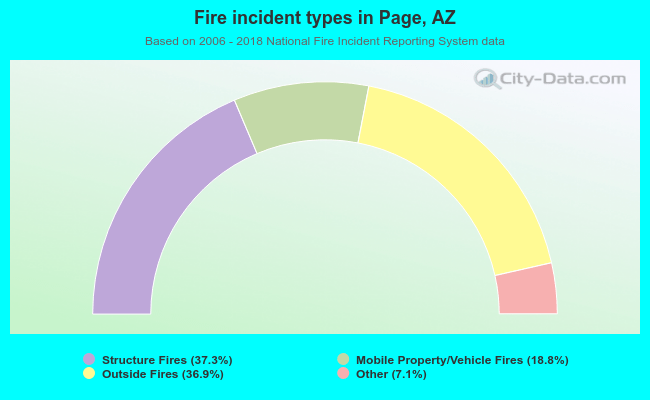 When looking into fire subcategories, the most reports belonged to: Structure Fires (37.3%), and Outside Fires (36.9%).