Owensboro: Fire Incidents, Kentucky (KY)
Where are fire incidents reported in Owensboro, KY
Something went wrong! Please refresh the page.
| Fire incidents reported | |
|---|---|
| Sreet name | Count |
| YALE PL | 1,508 |
| 4TH ST | 1,022 |
| FREDERICA ST | 738 |
| PARRISH AVE | 222 |
| 2ND ST | 162 |
| 9TH ST | 126 |
| BACK SQUARE DR | 116 |
| OLD HARTFORD RD | 104 |
| CARTER RD | 96 |
| 3RD ST | 84 |
| 5TH ST | 82 |
| NEW HARTFORD RD | 76 |
| REID RD | 76 |
| WENDELL FORD EXPY | 72 |
| HALL ST | 66 |
| TAMARACK RD | 66 |
| 7TH ST | 64 |
| AIRPARK DR | 64 |
| TRIPLETT ST | 64 |
| 19TH ST | 62 |
| BURLEW BLVD | 60 |
| WALNUT ST | 60 |
| 18TH ST | 58 |
| ALLEN ST | 58 |
| BYERS AVE | 58 |
| SOUTHTOWN BLVD | 56 |
| US 60 HWY | 56 |
| 10TH ST | 54 |
| BRECKENRIDGE ST | 52 |
| DAVIESS ST | 50 |
| Other | 1,741 |
2002 - 2018 National Fire Incident Reporting System (NFIRS) incidents
- Incident types reported to NFIRS in Owensboro, KY
- 26,88257.6%Rescue & EMS
- 7,17315.4%Fire
- 4,4059.4%Good Intent Call
- 3,7508.0%False Alarm
- 2,9706.4%Hazardous Condition
- 1,0902.3%Service Call
- 3120.7%Overpressure Rupture
- 600.1%Severe Weather
- Fire incident types reported to NFIRS in Owensboro, KY
- 3,45848.2%Structure Fires
- 2,35532.8%Outside Fires
- 96013.4%Mobile Property/Vehicle Fires
- 4005.6%Other
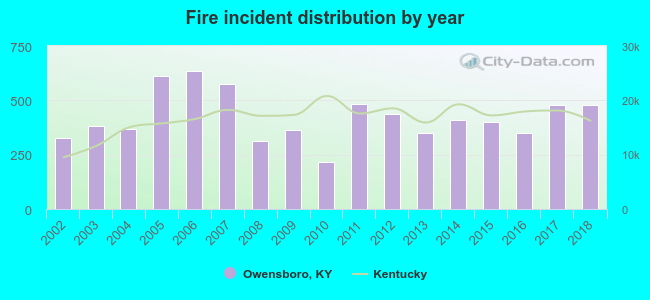 Based on the data from the years 2002 - 2018 the average number of fires per year is 422. The highest number of fires - 636 took place in 2006, and the least - 216 in 2010. The data has an increasing trend.
The average number of yearly fire incidents per 10k residents in Owensboro, KY compared to nearest cities:
(Note: Based on data for the last 3 years, including only cities with population 5,000 and above)
| Owensboro: | 74.6 |
| Spottsville: | 5.4 |
| Henderson: | 55.7 |
| Central City: | 99.5 |
| Madisonville: | 72.7 |
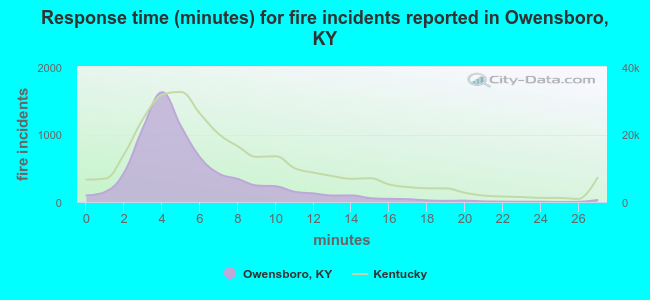 The median response time based on all reported fire incidents is 5 minutes. This is lower than the Kentucky median value.
The median response time in Owensboro, KY compared to nearest cities:
(Note: Based on data for all years, including only cities with at least 500 fire incidents)
| Owensboro: | 5 minutes |
| Newburgh: | 7 minutes |
| Boonville: | 5 minutes |
| Henderson: | 4 minutes |
| Evansville: | 4 minutes |
| Central City: | 8 minutes |
| Madisonville: | 5 minutes |
| Greenville: | 11 minutes |
| Oakland City: | 5 minutes |
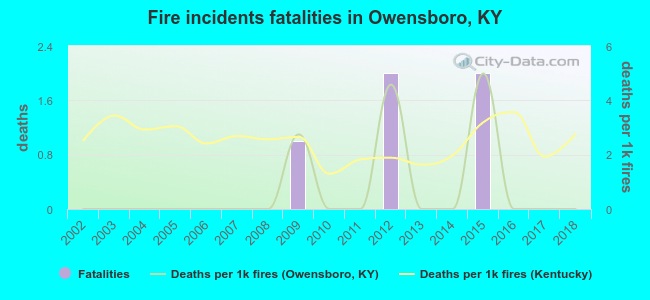 Based on the data from the years 2002 - 2018 the average number of fire-related fatalities per year is 0. The highest number of deaths - 2 took place in 2012, and the lowest - 0 in 2002. The data has a constant trend.
The average number of deaths per 1,000 fires is 1. This indicator was the highest - 5 in 2015, and the lowest 0 in 2002. The trend for deaths per 1,000 incidents is constant. Compared to the Kentucky value the number of deaths per 1,000 fires is much lower.
Based on the data from the years 2002 - 2018 the average number of fire-related fatalities per year is 0. The highest number of deaths - 2 took place in 2012, and the lowest - 0 in 2002. The data has a constant trend.
The average number of deaths per 1,000 fires is 1. This indicator was the highest - 5 in 2015, and the lowest 0 in 2002. The trend for deaths per 1,000 incidents is constant. Compared to the Kentucky value the number of deaths per 1,000 fires is much lower.Deaths per 1,000 incidents in Owensboro, KY compared to nearest cities:
(Note: Based on data for all years, including only cities with at least 2,500 fire incidents)
| Owensboro: | 0.7 |
| Evansville: | 2.6 |
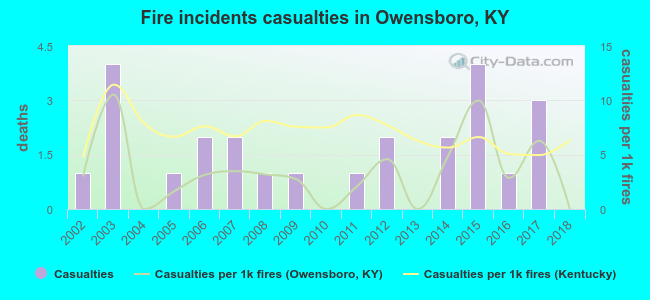 According to the reports from the years 2002 - 2018 the average number of fire-related yearly casualties is 1. The highest number of reported injuries - 4 took place in 2003, and the lowest - 0 in 2004. The data has a dropping trend.
The average number of injuries per 1,000 fires is 3. This indicator was the highest - 11 in 2003, and the lowest 0 in 2004. The trend for casualties per 1,000 fires is decreasing. Compared to the Kentucky value the number of injuries per 1,000 fires is much lower.
According to the reports from the years 2002 - 2018 the average number of fire-related yearly casualties is 1. The highest number of reported injuries - 4 took place in 2003, and the lowest - 0 in 2004. The data has a dropping trend.
The average number of injuries per 1,000 fires is 3. This indicator was the highest - 11 in 2003, and the lowest 0 in 2004. The trend for casualties per 1,000 fires is decreasing. Compared to the Kentucky value the number of injuries per 1,000 fires is much lower.Casualties per 1,000 incidents in Owensboro, KY compared to nearest cities:
(Note: Based on data for all years, including only cities with at least 500 fire incidents)
| Owensboro: | 3.5 |
| Newburgh: | 4.9 |
| Boonville: | 0.0 |
| Henderson: | 8.1 |
| Evansville: | 23.3 |
| Central City: | 3.7 |
| Madisonville: | 1.4 |
| Greenville: | 0.0 |
| Oakland City: | 0.0 |
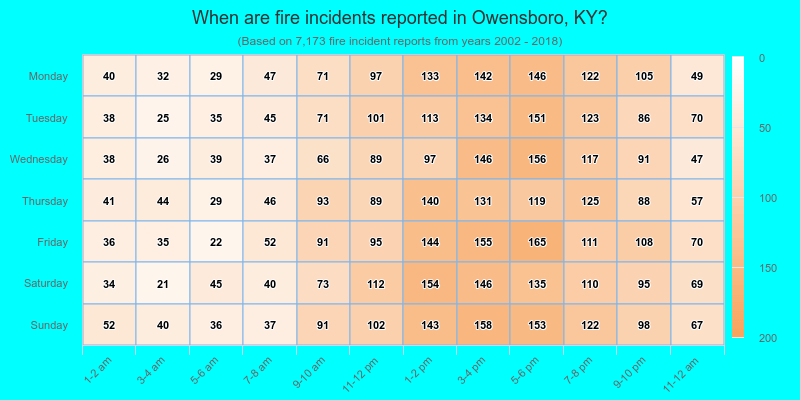
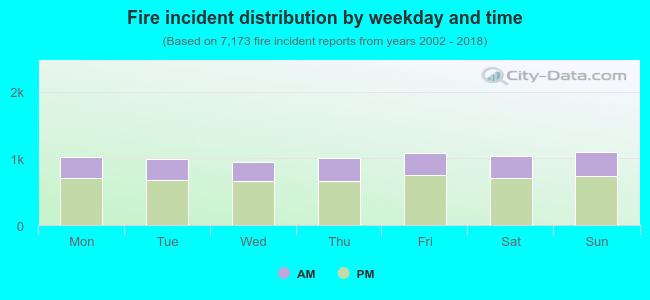 31.8% incidents where reported in the morning and 68.2% in the evening. The most fires (15.3%) took place on Sunday, and the least (13.2%) on Wednesday.
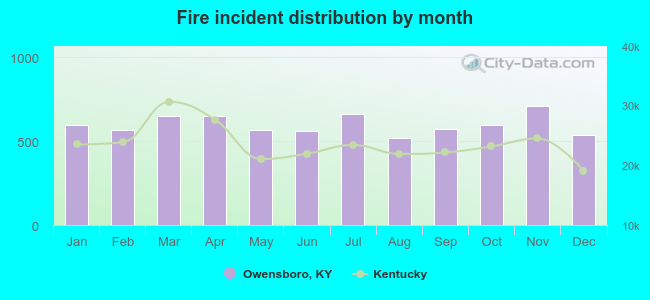 Based on the 7,173 fire incident reports from years 2002 - 2018 most fires (9.9%) took place during November, and the least (7.2%) in August.
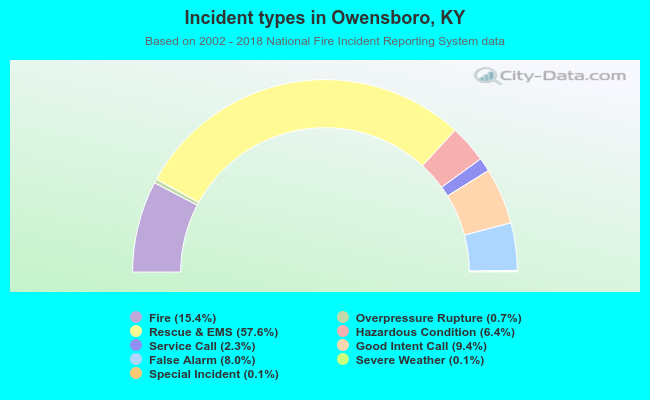 Out of all 46,671 cases reported during the years 2002 - 2018, the most belonged to the categories: Rescue & EMS (57.6%), Fire (15.4%), and Good Intent Call (9.4%).
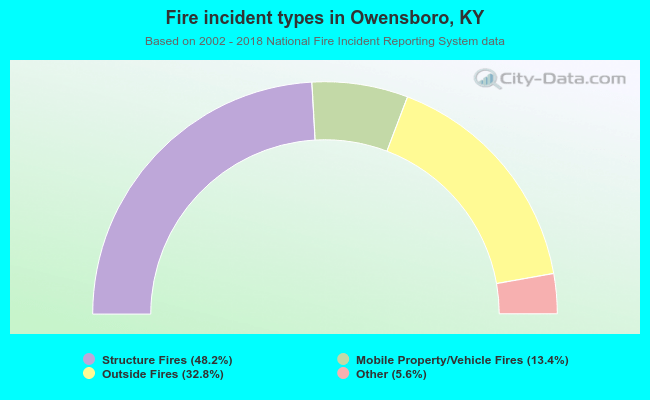 When looking into fire subcategories, the most incidents belonged to: Structure Fires (48.2%), and Outside Fires (32.8%).