| Fire incidents reported |
|---|
| Sreet name | Count |
|---|
| COUNTY ROAD 900 | 12 | | ST RD 356 | 12 | | ST RD 257 | 8 | | STATE RD 257 | 8 | | C. R. 850 E. | 6 | | COUNTY ROAD 1000 | 6 | | COUNTY ROAD 850 | 6 | | MECHANICS ST | 6 | | S.R. 56 | 6 | | C.R. 425 N | 4 | | COUNTY ROAD 50 | 4 | | COUNTY ROAD 825 E | 4 | | COUNTY ROAD 950 | 4 | | DEWEY ST | 4 | | DIVISON RD | 4 | | PIKE ST | 4 | | ST. RD. 257 | 4 | | STATE ROAD 56 | 4 | | 200 N | 2 | | 25 S CRD | 2 | | 500 RD | 2 | | 580N CRD | 2 | | 600 W | 2 | | 700 EAST CRD | 2 | | 750W CRD | 2 |
| | | Fire incidents reported |
|---|
| Sreet name | Count |
|---|
| 800 WEST CRD | 2 | | C. R. 400 N | 2 | | C. R. 550 N | 2 | | C. R. 725 E | 2 | | C.R. 425 | 2 | | C.R. 625 | 2 | | C.R. 900 | 2 | | COUNTY ROAD 250 | 2 | | COUNTY ROAD 500 | 2 | | COUNTY ROAD 700 | 2 | | COUNTY ROAD 825 | 2 | | COUNTY ROAD 950 E | 2 | | DIVISON RD. CRD | 2 | | GRANT ST | 2 | | HIMSEL RD. CRD | 2 | | HWY. 257 HWY | 2 | | MADISON ST. | 2 | | MCKINLEY ST | 2 | | OLD PETERSBURG RD. CRD | 2 | | OLD PETERSBURG ROAD | 2 | | PIKE ST. | 2 | | PORTERSVILLE RD | 2 | | PORTERSVILLE RD W | 2 | | PORTERSVILLE RD W CRD | 2 | | |
|
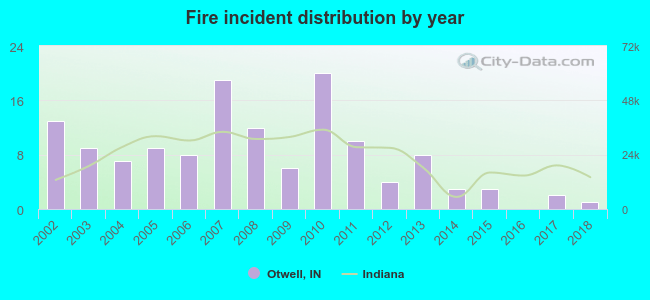 Based on the data from the years 2002 - 2018 the average number of fires per year is 8. The highest number of reported fire incidents - 20 took place in 2010, and the least - 0 in 2016. The data has a declining trend.
 27.6% incidents where reported in the morning and 72.4% in the evening. The most fires (21.6%) took place on Sunday, and the least (9.7%) on Saturday.
 Based on the 134 incident reports from years 2002 - 2018 most fires (14.2%) took place during March, and the least (2.2%) in May.
 Out of all 233 cases reported during the years 2002 - 2018, the most belonged to the categories: Fire (57.5%), Rescue & EMS (21.5%), and Hazardous Condition (12.4%).
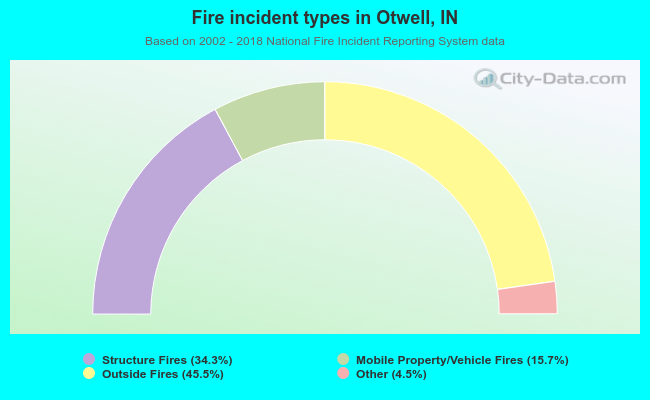 When looking into fire subcategories, the most incidents belonged to: Outside Fires (45.5%), and Structure Fires (34.3%).