| Fire incidents reported |
|---|
| Sreet name | Count |
|---|
| 1048 SCOTT ROAD | 6 | | SPRUCE ROAD | 6 | | 1208 SCOTT ROAD | 4 | | 2866 WILDS ROAD | 4 | | BROUSSEAU RD | 4 | | NICHOLSON HILL RD | 4 | | NICHOLSON HILL ROAD | 4 | | SCOTT RD | 4 | | SCOTT ROAD | 4 | | STATE STREET | 4 | | US 23 HWY | 4 | | 10087 SPRUCE ROAD | 2 | | 10118 SPRUCE ROAD | 2 | | 10358 SPRUCE ROAD | 2 | | 10401 PIPER ROAD | 2 | | 1048 E. SCOTT ROAD | 2 | | 10500 LAKE STREET | 2 | | 10593 EMERY LANE | 2 | | 10628 OSSINEKE ROAD | 2 | | 10700 WASHINTON STREET | 2 | | 11287 US-23 SOUTH | 2 | | 1135 NICHOLSON HILL ROAD | 2 | | 11364 CARRIVEAU ROAD | 2 | | 11390 SAMPSON | 2 | | 11470 SAMPSON ROAD | 2 |
| | | Fire incidents reported |
|---|
| Sreet name | Count |
|---|
| 1148 SCOTT ROAD | 2 | | 11516 OSSINSKE ROAD | 2 | | 11585 US-23 SOUTH | 2 | | 11596 US23 SOUTH | 2 | | 11752 OSSINEKE ROAD | 2 | | 11784 CARRIVEAU ROAD | 2 | | 11945 CARRIVEAU ROAD | 2 | | 12011 US23 SOUTH ST | 2 | | 12087 US-23 SOUTH | 2 | | 12159 BLANCARD ST | 2 | | 12620 BEHING ROAD | 2 | | 12880 US-23 SOUTH | 2 | | 12886 US23 SOUTH | 2 | | 13018 US23 SOUTH | 2 | | 13049 SPRUCE ROAD | 2 | | 13285 LYTLE ROAD | 2 | | 13699 SPRUCE ROAD | 2 | | 14305 SPRUCE ROAD | 2 | | 14370 US-23 SOUTH | 2 | | 1451 NICHOLSON HILL ROAD | 2 | | 14751 LYDLE ROAD | 2 | | 14870 LYTLE ROAD ST | 2 | | 1630 GERKE ROAD | 2 | | 1640 SCOTT ROAD | 2 | | 17707 SURBERT ROAD | 2 |
|
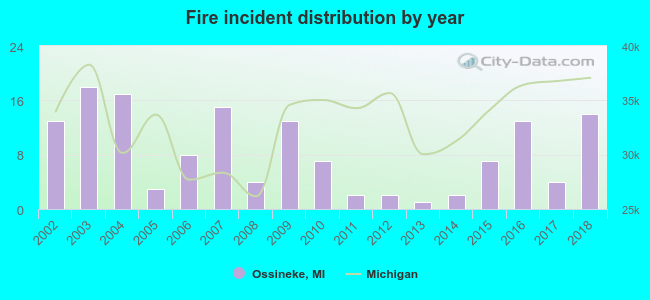 According to the data from the years 2002 - 2018 the average number of fires per year is 8. The highest number of fire incidents - 18 took place in 2003, and the least - 1 in 2013. The data has a growing trend.
 25.2% incidents where reported in the morning and 74.8% in the evening. The most fires (20.3%) took place on Saturday, and the least (10.5%) on Thursday.
 Based on the 143 fire incidents from years 2002 - 2018 most fires (14.7%) took place during April, and the least (4.9%) in February.
 Out of all 931 cases reported during the years 2002 - 2018, the most belonged to the categories: Rescue & EMS (70.1%), Fire (15.4%), and Hazardous Condition (8.5%).
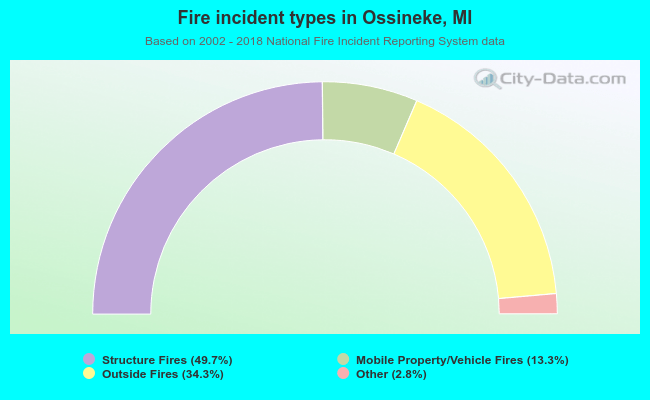 When looking into fire subcategories, the most reports belonged to: Structure Fires (49.7%), and Outside Fires (34.3%).