| Fire incidents reported |
|---|
| Sreet name | Count |
|---|
| BUCKEYE ST | 18 | | HASMER HILL RD | 18 | | FAIRGROUND RD | 12 | | ECKERT ST | 10 | | HIGHWAY 421 | 6 | | STATE ROAD 350 HWY | 6 | | C. R. 525 RD | 4 | | C.R. 100 RD | 4 | | COUNTY RD 350E | 4 | | LYNN ST | 4 | | MAPLE ST | 4 | | S.R. 350 HWY | 4 | | STREET | 4 | | SYCAMORE ST | 4 | | WILSON ST | 4 | | 200 RD | 2 | | 337 W COUNTY RD. 300 N. | 2 | | 350 | 2 | | 350 N | 2 | | 350 NORTH | 2 | | 600 | 2 | | 900 | 2 | | BEECH ST | 2 | | BEECHMONT ST | 2 | | BUCKEYE STREET OSGOOD | 2 |
| | | Fire incidents reported |
|---|
| Sreet name | Count |
|---|
| BUCKEYE STS | 2 | | C. R. 350 RD | 2 | | C. R. 500 | 2 | | C.R. 100 | 2 | | C.R. 600 RD | 2 | | C.R. 700 | 2 | | C.R. 700 RD | 2 | | CO RD 300 N | 2 | | CO RD 350N | 2 | | CO RD 525 N RD | 2 | | COUNTY RD 150E | 2 | | COUNTY RD 500N | 2 | | COUNTY ROAD 1050 | 2 | | COUNTY ROAD 100 | 2 | | COUNTY ROAD 200 N RD | 2 | | COUNTY ROAD 25 E RD | 2 | | COUNTY ROAD 300 | 2 | | COUNTY ROAD 300 N RD | 2 | | COUNTY ROAD 425N | 2 | | COUNTY ROAD 500 N RD | 2 | | COUNTY ROAD 500 RD | 2 | | COUNTY ROAD 650 N | 2 | | COUNTY ROAD 700 | 2 | | COUNTY ROAD 700N | 2 | | |
|
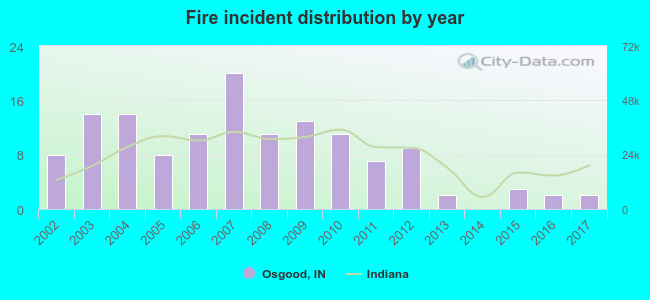 Based on the data from the years 2002 - 2017 the average number of fires per year is 8. The highest number of reported fire incidents - 20 took place in 2007, and the least - 0 in 2014. The data has a declining trend.
 37.0% incidents where reported in the morning and 63.0% in the evening. The most fires (18.5%) took place on Tuesday, and the least (11.9%) on Friday.
 Based on the 135 incident reports from years 2002 - 2017 most fires (11.9%) took place during March, and the least (5.2%) in May.
 Out of all 247 cases reported during the years 2002 - 2017, the most belonged to the categories: Fire (54.7%), Rescue & EMS (34.4%), and Service Call (6.1%).
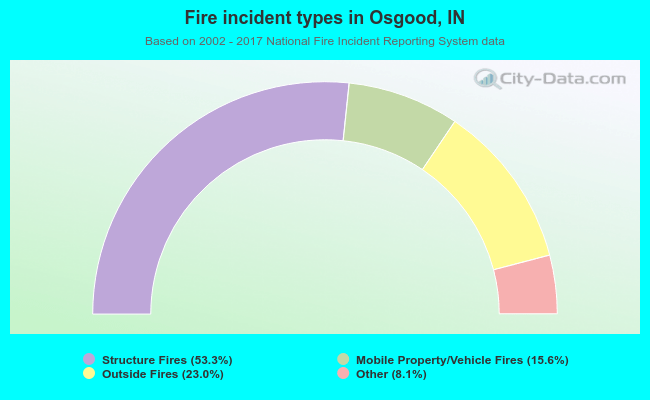 When looking into fire subcategories, the most incidents belonged to: Structure Fires (53.3%), and Outside Fires (23.0%).