Oscoda: Fire Incidents, Michigan (MI)
Where are fire incidents reported in Oscoda, MI
Something went wrong! Please refresh the page.
|
| |||||||||||||||||||||||||||||||||||||||||||||||||||||||||||||||||||||||||||||||||||||||||||||||||||||||||||||
| Other | 14 | |||||||||||||||||||||||||||||||||||||||||||||||||||||||||||||||||||||||||||||||||||||||||||||||||||||||||||||
2002 - 2018 National Fire Incident Reporting System (NFIRS) incidents
- Incident types reported to NFIRS in Oscoda, MI
- 47050.4%Fire
- 30232.4%Hazardous Condition
- 576.1%Good Intent Call
- 495.3%Rescue & EMS
- 262.8%Service Call
- 232.5%False Alarm
- 40.4%Overpressure Rupture
- 10.1%Severe Weather
- 10.1%Special Incident
- Fire incident types reported to NFIRS in Oscoda, MI
- 23650.2%Structure Fires
- 15533.0%Outside Fires
- 7115.1%Mobile Property/Vehicle Fires
- 81.7%Other
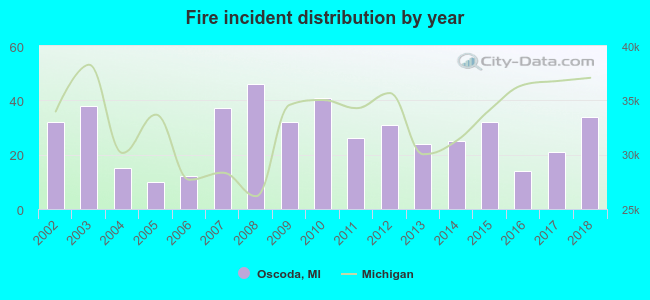 According to the data from the years 2002 - 2018 the average number of fire incidents per year is 28. The highest number of reported fires - 46 took place in 2008, and the least - 10 in 2005. The data has a rising trend.
 27.4% incidents where reported in the morning and 72.6% in the evening. The most fires (20.2%) took place on Sunday, and the least (11.5%) on Wednesday.
 According to the 470 fire incident reports from years 2002 - 2018 most fires (15.7%) took place during April, and the least (4.3%) in September.
 Out of all 933 cases reported during the years 2002 - 2018, the most belonged to the categories: Fire (50.4%), Hazardous Condition (32.4%), and Good Intent Call (6.1%).
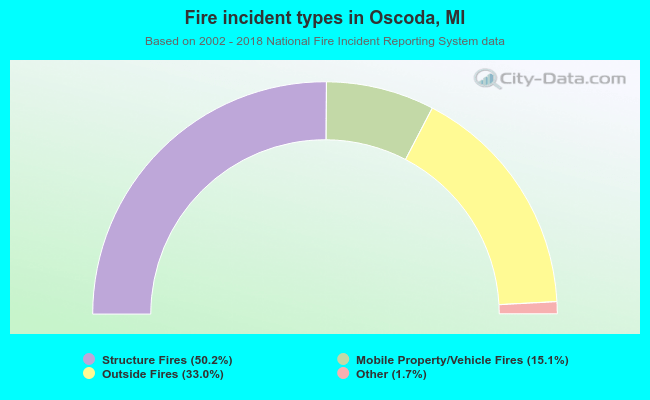 When looking into fire subcategories, the most incidents belonged to: Structure Fires (50.2%), and Outside Fires (33.0%).