| Fire incidents reported |
|---|
| Sreet name | Count |
|---|
| CENTRE TURNPIKE | 12 | | LIBERTY ST | 12 | | LONG AVE | 10 | | WARREN ST | 10 | | MIFFLIN ST | 8 | | CENTRE (35) TPKE | 6 | | MARKET ST | 6 | | SECOND MOUNTAIN ROAD | 6 | | CENTER TURNPIKE | 4 | | CENTRE TPKE | 4 | | CENTRE35 TPKE | 4 | | CHESTNUT | 4 | | GROVE ST | 4 | | HEMLOCK | 4 | | INDEPENDENCE ST | 4 | | LAKE FRONT DR | 4 | | MARKET (56) ST | 4 | | MARKET ST | 4 | | RED DALE RD | 4 | | SECOND MOUNTAIN RD | 4 | | SECOND MT RD | 4 | | SUMMER VALLEY | 4 | | WALBORN AVE | 4 | | WARREN | 4 | | 122 SOUTH LIBERTY ST | 2 |
| | | Fire incidents reported |
|---|
| Sreet name | Count |
|---|
| 122 SOUTH LIBERTY STREET | 2 | | 1358 CENTRE TURNPIKE | 2 | | 231 EAST INDEPENDENCE STR | 2 | | 2ND MOUNTAIN ??ROAD | 2 | | 529 SECOND MOUNTAIN ROAD | 2 | | 555 RT. 61 (W. BRUNSWICK) | 2 | | 733 E. SECOND MOUNTAIN RD \ | 2 | | BEECH ??ROAD | 2 | | BEECH ROAD | 2 | | BRIAR (18) RD | 2 | | BRICK HILL ROAD | 2 | | CENTER | 2 | | CENTER ??TURNPIKE | 2 | | CENTER TURNPIKE RD | 2 | | CENTRE ??TPKE | 2 | | CHESTNUT ??ROAD | 2 | | CHESTNUT RD | 2 | | CHESTNUT RIDGE | 2 | | CHESTNUT ST | 2 | | COAL MOUNTAIN RD | 2 | | COAL MOUNTAIN ROAD | 2 | | COUNTRY HILL ROAD | 2 | | DREHERSVILLE | 2 | | EAST MIFFLIN STREET | 2 | | EISENHOWER DRIVE | 2 |
|
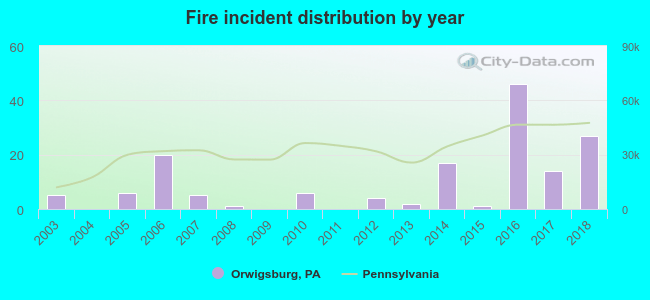 According to the data from the years 2003 - 2018 the average number of fire incidents per year is 10. The highest number of fire incidents - 46 took place in 2016, and the least - 0 in 2004. The data has a growing trend.
 42.9% incidents where reported in the morning and 57.1% in the evening. The most fires (21.4%) took place on Wednesday, and the least (4.5%) on Sunday.
 According to the 154 fire incident reports from years 2003 - 2018 most fires (18.8%) took place during November, and the least (2.6%) in August.
 Out of all 766 cases reported during the years 2003 - 2018, the most belonged to the categories: Overpressure Rupture (22.2%), Fire (20.1%), and Service Call (18.1%).
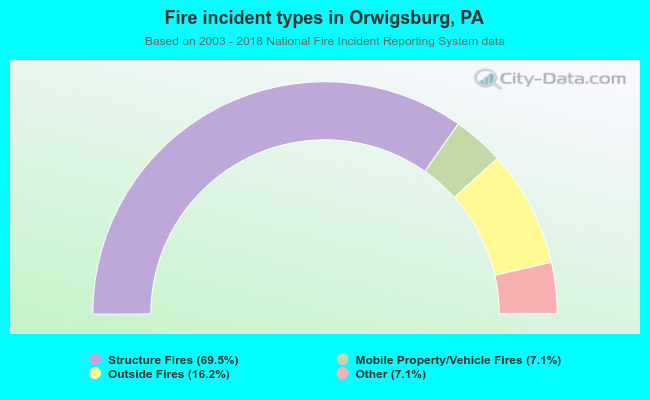 When looking into fire subcategories, the most reports belonged to: Structure Fires (69.5%), and Outside Fires (16.2%).