| Fire incidents reported |
|---|
| Sreet name | Count |
|---|
| STUART RD | 18 | | HIGHWAY 213 | 16 | | TOLLEFSON RD | 16 | | HIGHWAY 11 | 14 | | COON ISLAND RD | 10 | | BELOIT ST | 8 | | BRETTS WAY | 8 | | CLEOPHAS | 8 | | CLEOPHAS RD | 8 | | FRONT ST | 8 | | LANG RD | 8 | | MAIN ST | 8 | | SPRING VALLEY RD | 8 | | STATELINE RD | 8 | | WRIGHT ST | 8 | | 81 HWY | 6 | | CENTER ST | 6 | | CHURCH ST | 6 | | COUNTY K | 6 | | DICKEY RD | 6 | | HAFEMAN RD | 6 | | HWY 81 | 6 | | OFD STATION | 6 | | CARVER RD | 4 | | COUNTY ROAD H | 4 |
| | | Fire incidents reported |
|---|
| Sreet name | Count |
|---|
| EMERSON RD | 4 | | GROVE SCHOOL RD | 4 | | HIGHWAY 81 | 4 | | HOLDEN RD | 4 | | HWY 213 | 4 | | NELSON RD | 4 | | ORFORDVILLE-HANOVER RD | 4 | | SCHUMAN RD | 4 | | SPEICH RD | 4 | | ST LAWRENCE AVE | 4 | | ST LAWRENCE RD | 4 | | STATE HWY 81 | 4 | | 10502 HIGHWAY 213 | 2 | | 110 N MAIN ST | 2 | | 12552 W ST LAWRENCE RD | 2 | | 12759 BRANDHERM RD | 2 | | 213 W BELOIT ST | 2 | | 3346 POTTER RD. | 2 | | BELIOT ST | 2 | | BELOIT NEWARK | 2 | | BELOIT NEWARK RD | 2 | | BELOIT-NEWARK RD | 2 | | BERNSTEIN RD | 2 | | BERSTEIN RD | 2 | | BRANDHEIRM RD | 2 |
|
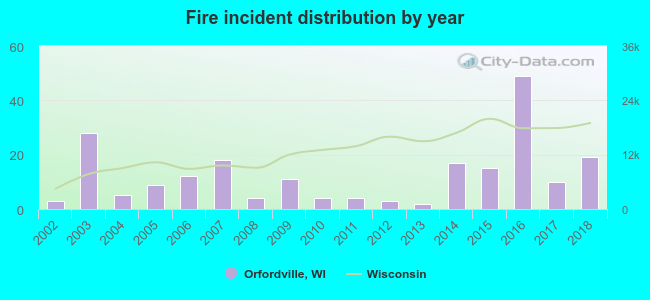 Based on the data from the years 2002 - 2018 the average number of fire incidents per year is 13. The highest number of reported fires - 49 took place in 2016, and the least - 2 in 2013. The data has an increasing trend.
 25.4% incidents where reported in the morning and 74.6% in the evening. The most fires (16.9%) took place on Friday, and the least (10.3%) on Monday.
 Based on the 213 fire incident reports from years 2002 - 2018 most fires (22.1%) took place during April, and the least (3.8%) in May.
 Out of all 689 cases reported during the years 2002 - 2018, the most belonged to the categories: Overpressure Rupture (47.2%), Fire (30.9%), and Hazardous Condition (7.7%).
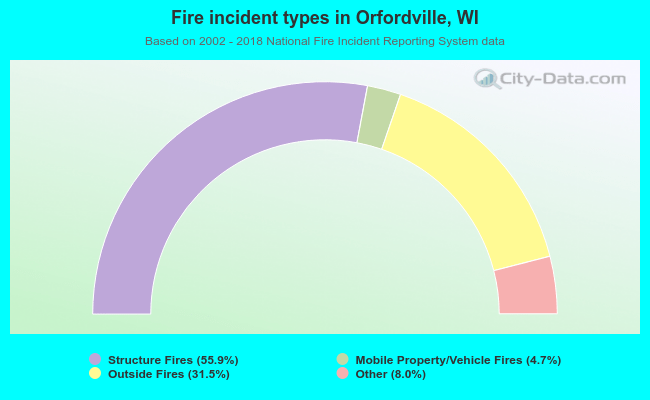 When looking into fire subcategories, the most reports belonged to: Structure Fires (55.9%), and Outside Fires (31.5%).