| Fire incidents reported |
|---|
| Sreet name | Count |
|---|
| ELDORADO RD | 8 | | 13010 N SHOWERS RD | 6 | | 3131 W ORANGEVILLE RD | 6 | | ROCK GROVE RD | 6 | | 1283 E ROCK GROVE RD | 4 | | 3803 W BASSWOOD RD | 4 | | 3971 E ROCK GROVE RD | 4 | | HENDERSON RD | 4 | | PLEASANT HILL RD | 4 | | 10715 OLD RT26N | 2 | | 100 MAIN ST | 2 | | 10006 ROTE RD | 2 | | 1004 W ROCK GROVE RD | 2 | | 102 S MILL ST | 2 | | 10367 N HENDERSON RD | 2 | | 105 S CHURCH | 2 | | 10598 ROTE RD | 2 | | 106 E HIGH ST | 2 | | 106 S EAST ST | 2 | | 1060 W ROCK GROVE RD | 2 | | 10681 RT 26N | 2 | | 10715 OLD RT 26 N | 2 | | 10715 OLD RT. 26NORTH | 2 | | 1106 W. ROCK GROVE RD. | 2 | | 1106 W.ROCK GROVE RD | 2 |
| | | Fire incidents reported |
|---|
| Sreet name | Count |
|---|
| 111 S MAIN ST | 2 | | 11511 N HULBERT RD | 2 | | 11590 RT 26 N | 2 | | 1161 E ROCK GROVE RD | 2 | | 11734 NSHOWERS RD | 2 | | 11743 N SHOWERS RD | 2 | | 11958 N ZIMMERMAN RD | 2 | | 12089 N SEIDEL RD | 2 | | 12369 OLD RT 26N | 2 | | 12486 N HENDERSON RD | 2 | | 12619 RT 26 N | 2 | | 12650 OLD RT. 26 NORTH | 2 | | 12727 IL RT 26 N | 2 | | 12780 N BRIGGS RD | 2 | | 12934 N DAMACUS RD | 2 | | 12945 N SHOWERS RD | 2 | | 12997 N SHOWERS RD | 2 | | 13006 N COON RD | 2 | | 13049 N VAN METER RD | 2 | | 13070 N BOLENDER RD | 2 | | 13102 IMOBERSTEG | 2 | | 1323 W BRUSH CREEK RD | 2 | | 1323 W ST JAMES RD | 2 | | 13710 N ZIMMERMANRD | 2 | | 13778 N HOGBACK RD | 2 |
|
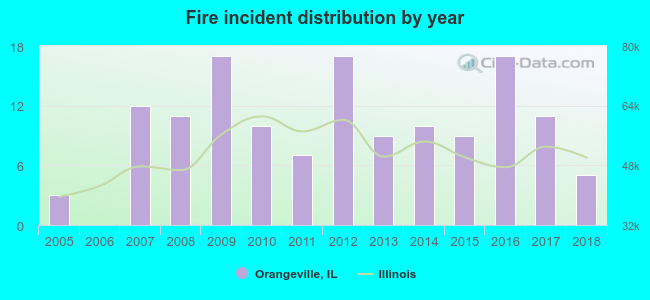 According to the data from the years 2005 - 2018 the average number of fire incidents per year is 10. The highest number of reported fire incidents - 17 took place in 2009, and the least - 0 in 2006. The data has a growing trend.
 27.5% incidents where reported in the morning and 72.5% in the evening. The most fires (18.8%) took place on Friday, and the least (8.7%) on Wednesday.
 Based on the 138 fires from years 2005 - 2018 most fires (27.5%) took place during April, and the least (2.9%) in December.
 Out of all 390 cases reported during the years 2005 - 2018, the most belonged to the categories: Overpressure Rupture (54.6%), Fire (35.4%), and Good Intent Call (3.1%).
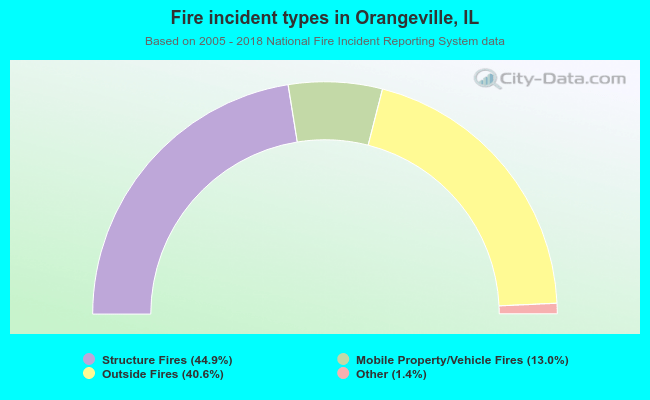 When looking into fire subcategories, the most incidents belonged to: Structure Fires (44.9%), and Outside Fires (40.6%).