Opelika: Fire Incidents, Alabama (AL)
Where are fire incidents reported in Opelika, AL
Something went wrong! Please refresh the page.
| Fire incidents reported | |
|---|---|
| Sreet name | Count |
| INTERSTATE 85 | 592 |
| 280 HWY | 160 |
| PEPPERELL PKY | 149 |
| BIRMINGHAM HWY | 114 |
| 1ST AVE | 110 |
| COLUMBUS PKWY | 110 |
| 3RD AVE | 105 |
| FREDERICK RD | 105 |
| CRAWFORD RD | 99 |
| 2ND AVE | 95 |
| PEPPERELL PKWY | 85 |
| UNIROYAL RD | 80 |
| GATEWAY DR | 75 |
| I85 | 75 |
| ANTIOCH CIR | 70 |
| COLUMBUS PKY | 70 |
| LONG ST | 70 |
| OLD COLUMBUS RD | 69 |
| DALE AVE | 60 |
| JETER AVE | 60 |
| LAFAYETTE PKY | 60 |
| MARVYN PKWY | 60 |
| NORTHPARK DR | 60 |
| WEST POINT PKY | 60 |
| MARVYN PKY | 59 |
| ENTERPRISE DR | 50 |
| HURST ST | 50 |
| INDUSTRIAL BLVD | 50 |
| NORTHGATE DR | 50 |
| RAILROAD AVE | 45 |
2003 - 2018 National Fire Incident Reporting System (NFIRS) incidents
- Incident types reported to NFIRS in Opelika, AL
- 11,46867.0%Rescue & EMS
- 1,6619.7%Hazardous Condition
- 1,4478.5%Fire
- 1,0886.4%False Alarm
- 7184.2%Service Call
- 3472.0%Special Incident
- 3352.0%Good Intent Call
- 440.3%Overpressure Rupture
- Fire incident types reported to NFIRS in Opelika, AL
- 63143.6%Outside Fires
- 43029.7%Structure Fires
- 28819.9%Mobile Property/Vehicle Fires
- 986.8%Other
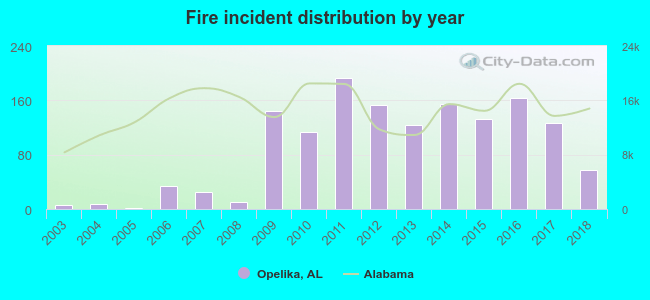 According to the data from the years 2003 - 2018 the average number of fire incidents per year is 90. The highest number of fires - 193 took place in 2011, and the least - 1 in 2005. The data has a rising trend.
The average number of yearly fire incidents per 10k residents in Opelika, AL compared to nearest cities:
(Note: Based on data for the last 3 years, including only cities with population 5,000 and above)
| Opelika: | 39.8 |
| Auburn: | 24.6 |
| Beulah: | 1.6 |
| Valley: | 43.0 |
| Smiths Station: | 80.0 |
| Smiths: | 13.9 |
| Lanett: | 69.8 |
| Phenix City: | 37.5 |
| Roanoke: | 32.7 |
 The median response time based on all reported fire incidents is 4 minutes. This is lower than the state median value.
The median response time in Opelika, AL compared to nearest cities:
(Note: Based on data for all years, including only cities with at least 500 fire incidents)
| Opelika: | 4 minutes |
| Auburn: | 5 minutes |
| Valley: | 6 minutes |
| Smiths: | 8 minutes |
| Phenix City: | 4 minutes |
| Dadeville: | 11 minutes |
| Tallassee: | 10 minutes |
| Roanoke: | 5 minutes |
| Alexander City: | 5 minutes |
 According to the reports from the years 2003 - 2018 the average number of fire-related fatalities per year is 1. The highest number of reported deaths - 3 took place in 2011, and the lowest - 0 in 2003. The data has a constant trend.
 According to the data from the years 2003 - 2018 the average number of fire-related yearly casualties is 1. The highest number of reported injuries - 3 took place in 2017, and the lowest - 0 in 2003. The data has a constant trend.
The average number of injuries per 1,000 fire incidents is 5. This indicator was the highest - 24 in 2017, and the lowest 0 in 2003. The trend for injuries per 1,000 fires is constant. Compared to the state value the number of casualties per 1,000 incidents is higher.
According to the data from the years 2003 - 2018 the average number of fire-related yearly casualties is 1. The highest number of reported injuries - 3 took place in 2017, and the lowest - 0 in 2003. The data has a constant trend.
The average number of injuries per 1,000 fire incidents is 5. This indicator was the highest - 24 in 2017, and the lowest 0 in 2003. The trend for injuries per 1,000 fires is constant. Compared to the state value the number of casualties per 1,000 incidents is higher.Casualties per 1,000 incidents in Opelika, AL compared to nearest cities:
(Note: Based on data for all years, including only cities with at least 500 fire incidents)
| Opelika: | 7.6 |
| Auburn: | 0.8 |
| Valley: | 8.9 |
| Smiths: | 2.0 |
| Phenix City: | 3.6 |
| Dadeville: | 3.6 |
| Tallassee: | 1.9 |
| Roanoke: | 12.1 |
| Alexander City: | 1.4 |
 30.1% incidents where reported in the morning and 69.9% in the evening. The most fires (15.5%) took place on Saturday, and the least (13.3%) on Wednesday.
 According to the 1,447 reports from years 2003 - 2018 most fires (11.0%) took place during March, and the least (6.0%) in September.
 Out of all 17,121 cases reported during the years 2003 - 2018, the most belonged to the categories: Rescue & EMS (67.0%), Hazardous Condition (9.7%), and Fire (8.5%).
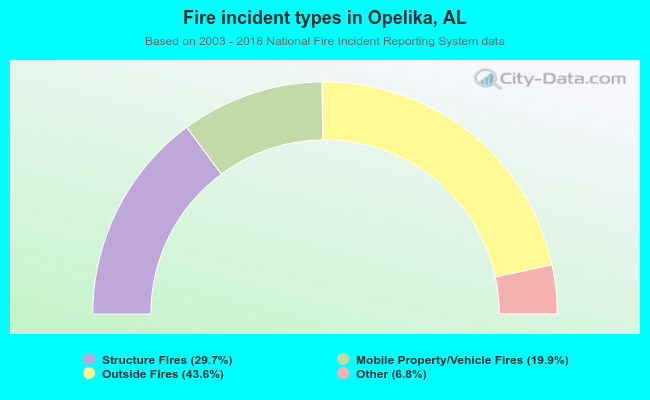 When looking into fire subcategories, the most reports belonged to: Outside Fires (43.6%), and Structure Fires (29.7%).