| Fire incidents reported |
|---|
| Sreet name | Count |
|---|
| 2700 KNOX HWY 6 | 4 | | DAYTON | 4 | | 1016 KNOX RD 2150 N | 2 | | 1026 KNOX RD 2600 N | 2 | | 1045 KNOX RD 2800 N | 2 | | 1045 KNOX ROAD 2800 NORTH | 2 | | 1050 CO 35 | 2 | | 108 S. KNOX ST | 2 | | 108 S. KNOX XT | 2 | | 1200 BLOCK US 34 | 2 | | 1240 E 2069 | 2 | | 125 NJOY ST LGTS | 2 | | 1271 KNOX RD 2500 N | 2 | | 1294 2100 NORTH | 2 | | 1294 2100N | 2 | | 1307 2500 N | 2 | | 133 S GROVE ST | 2 | | 134 N SAGE ST | 2 | | 134 S JOY ST | 2 | | 1340 RT 167 | 2 | | 135 KNOX ST | 2 | | 1350 E 2500 N | 2 | | 1400 BLOCK RT 167 | 2 | | 205 W HWY | 2 | | 2074 FOXTOWN RD | 2 |
| | | Fire incidents reported |
|---|
| Sreet name | Count |
|---|
| 210 N SAGE ST LGTS | 2 | | 2148 KNOX RD 1200 EAST | 2 | | 219 E DAYTON ST | 2 | | 221 N WATAGA ST | 2 | | 2269 KNOX RD 1240E LGTS | 2 | | 227 N KONX ST | 2 | | 2289 KNOX RD 1000 E | 2 | | 2300N 1100E | 2 | | 2337 KNOX RD 1240 E | 2 | | 234 S JOY ST | 2 | | 2358 KNOX RD 1125 E | 2 | | 2364 KNOX RD 1125E LGTS | 2 | | 2364 N 1125 E | 2 | | 238 N WATAGA ST | 2 | | 2400 KNOX HWY 12 | 2 | | 2400 N KNOX HWY 3 | 2 | | 2400 N. 1240 E | 2 | | 2416 KNOX HWY 12 | 2 | | 2474 KNOX RD 500 E | 2 | | 2476 KNOX HWY 36 | 2 | | 2481 KNOX ROAD 600 E | 2 | | 2481 KNOX ROAD 600E | 2 | | 2500 1240 E | 2 | | 2500 BLOCK US 34 | 2 | | 2500 KNOX HWY 3 | 2 |
|
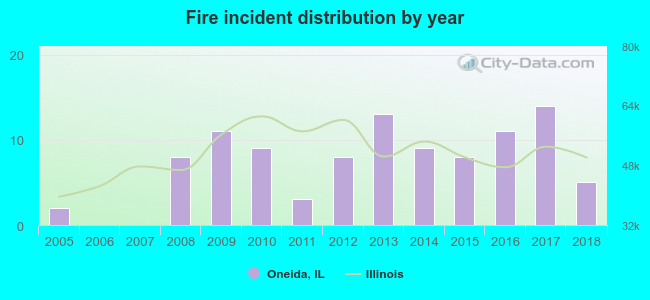 According to the data from the years 2005 - 2018 the average number of fire incidents per year is 7. The highest number of reported fire incidents - 14 took place in 2017, and the least - 0 in 2006. The data has a growing trend.
 22.8% incidents where reported in the morning and 77.2% in the evening. The most fires (18.8%) took place on Friday, and the least (9.9%) on Tuesday.
 Based on the 101 fires from years 2005 - 2018 most fires (22.8%) took place during March, and the least (2.0%) in August.
 Out of all 328 cases reported during the years 2005 - 2018, the most belonged to the categories: Overpressure Rupture (39.9%), Fire (30.8%), and Rescue & EMS (16.5%).
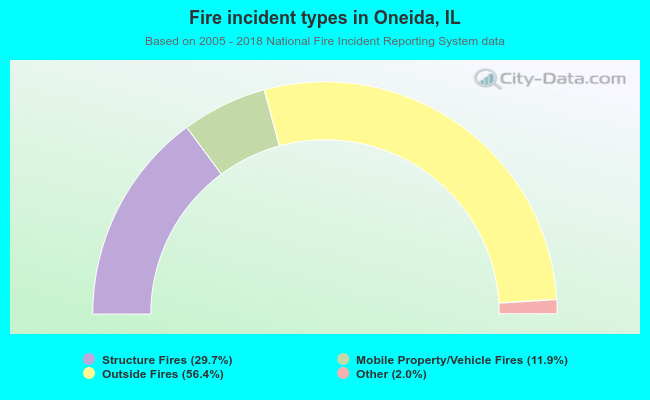 When looking into fire subcategories, the most incidents belonged to: Outside Fires (56.4%), and Structure Fires (29.7%).