| Fire incidents reported |
|---|
| Sreet name | Count |
|---|
| MAIN ST | 6 | | RIVERMOOR RD | 6 | | HURON ST | 4 | | HWY 116 | 4 | | JACQUIS RD | 4 | | 1248 HWY 91 | 2 | | 144 EONTARIO | 2 | | 147 POYGAN AVE | 2 | | 151 NATHAN COURT | 2 | | 205 MADISON AVE | 2 | | 2063 COUNTY ROAD M | 2 | | 225 OMREAU AVE | 2 | | 233 EAST SCOTT | 2 | | 233 MADISON AVE. | 2 | | 244 E. MAIN ST | 2 | | 250 AUDER AVE | 2 | | 2519 HWY 116 | 2 | | 2791 CTY FF | 2 | | 301 MCKINLEY AVE | 2 | | 3102 HEISE ROAD | 2 | | 311 E LARRABEE ST | 2 | | 312 JACKSON ST | 2 | | 312 JACKSON STREET | 2 | | 3162 HEISE RD | 2 | | 3175 CTY HWY E | 2 |
| | | Fire incidents reported |
|---|
| Sreet name | Count |
|---|
| 330 MAIN ST | 2 | | 330 W MAIN ST APT 102 | 2 | | 3323 CTY HWY K | 2 | | 3800 POTRATZ HILL RD | 2 | | 3829 POTRATZ HILL RD | 2 | | 3866 CTY FF | 2 | | 404 MADISON AVE | 2 | | 4107 SOUTH SPRING ROAD | 2 | | 421 RIVER VIEW | 2 | | 4222 RIVERMOOR RD | 2 | | 4222 RIVERMOOR ROAD | 2 | | 430 N. WEBSTER | 2 | | 4360 SWALLOW BANKS | 2 | | 4393 HARBOR VILLAGE DR | 2 | | 440 TORI STREET | 2 | | 4425 RUSHFORD AVE | 2 | | 4504 RIVERMOOR ROAD | 2 | | 4515 CTY TK F | 2 | | 4577 POYGAN AVE | 2 | | 4592 RIVERMOOR RD | 2 | | 4831 RIVERMOOR ROAD | 2 | | 504 HARRISON AVE | 2 | | 505 SPRUCE ST | 2 | | 5099 MALIBU COVE | 2 | | 510 MCKINLEY AVE | 2 |
|
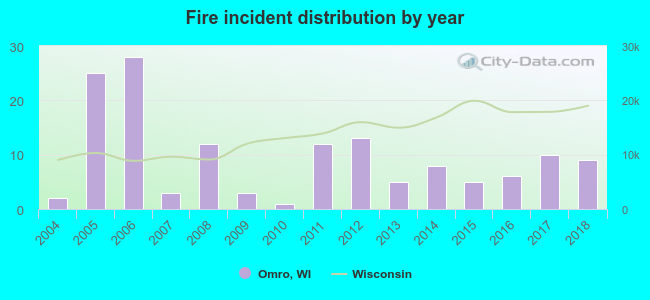 Based on the data from the years 2004 - 2018 the average number of fire incidents per year is 9. The highest number of reported fire incidents - 28 took place in 2006, and the least - 1 in 2010. The data has a rising trend.
 23.9% incidents where reported in the morning and 76.1% in the evening. The most fires (19.7%) took place on Monday, and the least (9.2%) on Wednesday.
 According to the 142 fire incident reports from years 2004 - 2018 most fires (14.8%) took place during April, and the least (4.9%) in October.
 Out of all 1,018 cases reported during the years 2004 - 2018, the most belonged to the categories: Overpressure Rupture (61.7%), Fire (13.9%), and Rescue & EMS (12.9%).
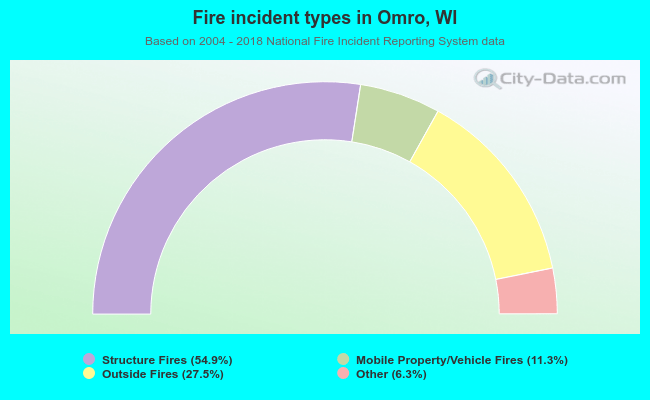 When looking into fire subcategories, the most reports belonged to: Structure Fires (54.9%), and Outside Fires (27.5%).