Olyphant: Fire Incidents, Pennsylvania (PA)
Where are fire incidents reported in Olyphant, PA
Something went wrong! Please refresh the page.
|
| |||||||||||||||||||||||||||||||||||||||||||||||||||||||||||||||||||||||||||||||||||||||||||||||||||||||||||||
2003 - 2018 National Fire Incident Reporting System (NFIRS) incidents
- Incident types reported to NFIRS in Olyphant, PA
- 21426.0%Fire
- 18722.7%False Alarm
- 13015.8%Hazardous Condition
- 11814.4%Rescue & EMS
- 819.9%Service Call
- 627.5%Good Intent Call
- 172.1%Special Incident
- 91.1%Severe Weather
- 40.5%Overpressure Rupture
- Fire incident types reported to NFIRS in Olyphant, PA
- 9042.1%Structure Fires
- 8238.3%Outside Fires
- 2210.3%Other
- 209.3%Mobile Property/Vehicle Fires
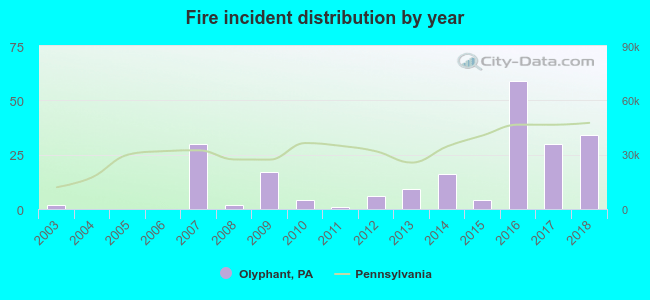 According to the data from the years 2003 - 2018 the average number of fire incidents per year is 13. The highest number of fire incidents - 59 took place in 2016, and the least - 0 in 2004. The data has a growing trend.
The average number of yearly fire incidents per 10k residents in Olyphant, PA compared to nearest cities:
(Note: Based on data for the last 3 years, including only cities with population 5,000 and above)
| Olyphant: | 78.7 |
| Blakely: | 13.9 |
| Dickson City: | 25.5 |
| Archbald: | 29.7 |
| Dunmore: | 16.9 |
| Scranton: | 21.6 |
| Clarks Summit: | 28.3 |
| Taylor: | 4.9 |
| Carbondale: | 16.7 |

 28.0% incidents where reported in the morning and 72.0% in the evening. The most fires (21.0%) took place on Saturday, and the least (10.3%) on Sunday.
 According to the 214 fire incident reports from years 2003 - 2018 most fires (15.0%) took place during March, and the least (3.7%) in August.
 Out of all 822 cases reported during the years 2003 - 2018, the most belonged to the categories: Fire (26.0%), False Alarm (22.7%), and Hazardous Condition (15.8%).
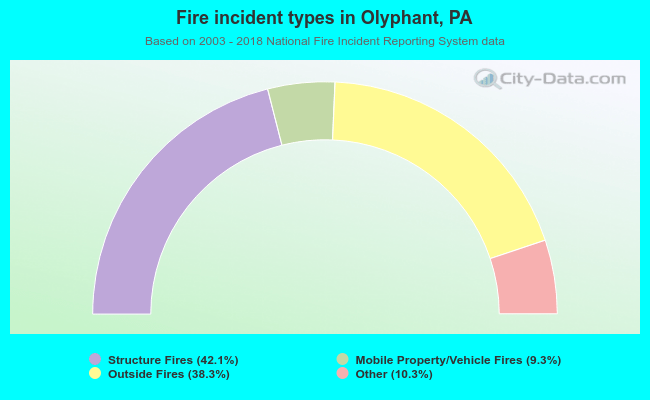 When looking into fire subcategories, the most reports belonged to: Structure Fires (42.1%), and Outside Fires (38.3%).