| Fire incidents reported |
|---|
| Sreet name | Count |
|---|
| ROUTE 3 | 16 | | MILLER CITY RD | 10 | | PIGEON ROOST ROAD | 10 | | PIEGEON ROOST ROAD | 8 | | RT 3 | 8 | | STATE HIGHWAY 3 | 8 | | GREG HOLLOW RD | 6 | | OLD MILL ROAD | 6 | | TAMMAS - OLIVE BRANCH RD. | 6 | | UNITY ROAD | 6 | | 22253 FAYVILLE ROAD | 4 | | CENTER RAILROAD | 4 | | FAYVILLE RD | 4 | | FAYVILLE RD | 4 | | FAYVILLE ROAD | 4 | | ISLAND RD | 4 | | PECAN RD | 4 | | PIGEON ROOST RD | 4 | | PLEASENT VALLEY LN. | 4 | | RAILROAD ST | 4 | | ROUT3 | 4 | | STATE HWY 3 | 4 | | TAMMS OLIVE BRANCH | 4 | | GREG HOLLOW | 2 | | 19866 CLANK ROAD | 2 |
| | | Fire incidents reported |
|---|
| Sreet name | Count |
|---|
| 20508 PLEASANT VALLEY RD | 2 | | 20508 TAMMS OLIVE BRANCH RD | 2 | | 21359 NORTH STREET | 2 | | 21382 ILL AVE | 2 | | 21584 ROUTE 3 | 2 | | 21630 SHIPLEY ROAD | 2 | | 21831 PECON ROAD | 2 | | 21842 SOUTH STREET | 2 | | 21900 SOUTH STRRET | 2 | | 22026 OAKWOOD ROAD | 2 | | 22320 FAYVILLE RD | 2 | | 22479 OLD MILL ROAD | 2 | | 22564OLD HORSESHOE LAKE ROAD | 2 | | 22569 WEST STREET | 2 | | 22619 MEMORIAL LANE | 2 | | 23049 OLIVE STREET | 2 | | 23056 PIGEON ROOST ROAD | 2 | | 23884 OLIVE ROAD | 2 | | 25485 ROUTE 3 | 2 | | 26235 ROYAL OAK LANE | 2 | | 26415 STATE HWY 3 | 2 | | 27263 MILLER CITY ROAD | 2 | | 27380 MILLER CITY ROAD | 2 | | 2ND & OLIVE STREET | 2 | | |
|
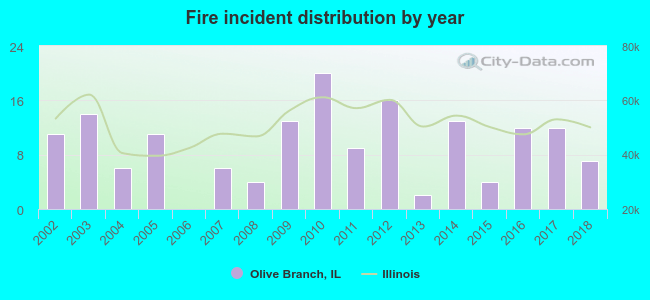 According to the data from the years 2002 - 2018 the average number of fire incidents per year is 9. The highest number of fire incidents - 20 took place in 2010, and the least - 0 in 2006. The data has a declining trend.
 29.4% incidents where reported in the morning and 70.6% in the evening. The most fires (18.1%) took place on Thursday, and the least (10.0%) on Sunday.
 Based on the 160 fire incident reports from years 2002 - 2018 most fires (16.3%) took place during March, and the least (3.8%) in May.
 Out of all 274 cases reported during the years 2002 - 2018, the most belonged to the categories: Fire (58.4%), Overpressure Rupture (21.9%), and Service Call (6.6%).
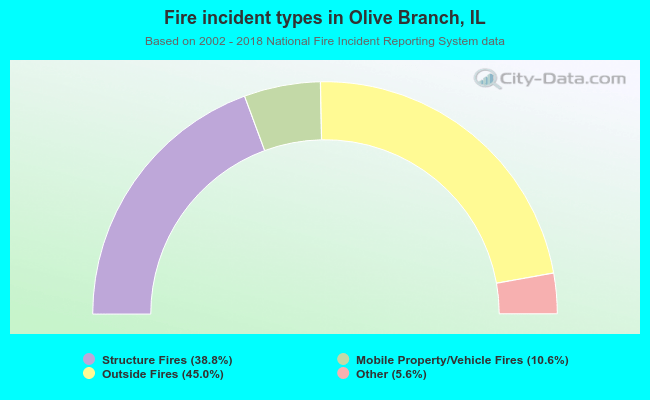 When looking into fire subcategories, the most incidents belonged to: Outside Fires (45.0%), and Structure Fires (38.8%).