Oklahoma City: Fire Incidents, Oklahoma (OK)
Where are fire incidents reported in Oklahoma City, OK
Something went wrong! Please refresh the page.
| Fire incidents reported | |
|---|---|
| Sreet name | Count |
| PENNSYLVANIA AVE | 986 |
| 10TH ST | 928 |
| 23RD ST | 850 |
| MAY AVE | 836 |
| WESTERN AVE | 724 |
| 44TH ST | 676 |
| MERIDIAN AVE | 630 |
| MACARTHUR BLVD | 618 |
| 59TH ST | 614 |
| 15TH ST | 598 |
| 29TH ST | 588 |
| RENO AVE | 482 |
| 25TH ST | 460 |
| COUNCIL RD | 450 |
| PORTLAND AVE | 426 |
| 22ND ST | 398 |
| 16TH ST | 382 |
| 39TH ST | 372 |
| 28TH ST | 360 |
| WALKER AVE | 358 |
| 50TH ST | 356 |
| BRITTON RD | 356 |
| 36TH ST | 352 |
| ROCKWELL AVE | 348 |
| GRAND BLVD | 346 |
| 89TH ST | 344 |
| MEMORIAL RD | 344 |
| 122ND ST | 340 |
| 24TH ST | 326 |
| 27TH ST | 316 |
| Other | 13,807 |
2007 - 2018 National Fire Incident Reporting System (NFIRS) incidents
- Incident types reported to NFIRS in Oklahoma City, OK
- 154,60253.7%Rescue & EMS
- 44,43515.4%Good Intent Call
- 28,97110.1%Fire
- 25,2288.8%Service Call
- 18,9386.6%Hazardous Condition
- 14,3575.0%False Alarm
- 9350.3%Special Incident
- 3500.1%Overpressure Rupture
- Fire incident types reported to NFIRS in Oklahoma City, OK
- 11,95941.3%Outside Fires
- 11,13038.4%Structure Fires
- 4,97917.2%Mobile Property/Vehicle Fires
- 9033.1%Other
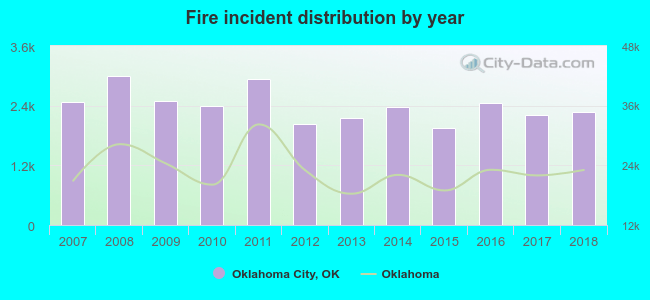 Based on the data from the years 2007 - 2018 the average number of fire incidents per year is 2,396. The highest number of fire incidents - 2,996 took place in 2008, and the least - 1,944 in 2015. The data has a declining trend.
The average number of yearly fire incidents per 10k residents in Oklahoma City, OK compared to nearest cities:
(Note: Based on data for the last 3 years, including only cities with population 5,000 and above)
| Oklahoma City: | 37.3 |
| Warr Acres: | 38.4 |
| Del City: | 42.6 |
| Bethany: | 32.2 |
| The Village: | 24.7 |
| Midwest City: | 30.6 |
| Moore: | 24.7 |
| Yukon: | 78.8 |
| Mustang: | 48.0 |
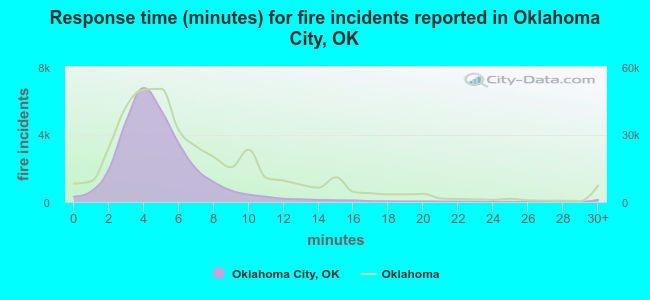 The median response time based on all reported fire incidents is 5 minutes. This is lower than the Oklahoma median value.
The median response time in Oklahoma City, OK compared to nearest cities:
(Note: Based on data for all years, including only cities with at least 500 fire incidents)
| Oklahoma City: | 5 minutes |
| Warr Acres: | 3 minutes |
| Del City: | 3 minutes |
| Bethany: | 4 minutes |
| The Village: | 3 minutes |
| Midwest City: | 5 minutes |
| Spencer: | 4 minutes |
| Moore: | 4 minutes |
| Yukon: | 6 minutes |
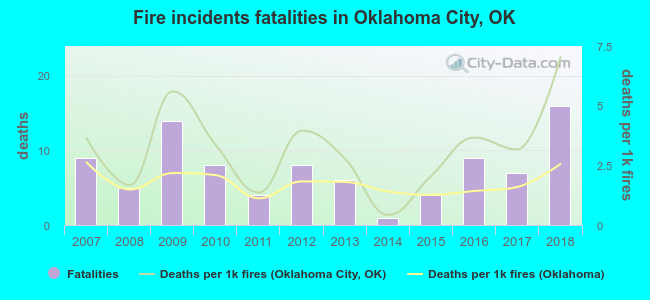 Based on the reports from the years 2007 - 2018 the average number of fire-related fatalities per year is 8. The highest number of deaths - 16 took place in 2018, and the lowest - 1 in 2014. The data has a rising trend.
The average number of deaths per 1,000 fires is 3. This indicator was the highest - 7 in 2018, and the lowest 0 in 2014. The trend for fatalities per 1,000 fire incidents is growing. Compared to the Oklahoma value the number of fatalities per 1,000 fire incidents is higher.
Based on the reports from the years 2007 - 2018 the average number of fire-related fatalities per year is 8. The highest number of deaths - 16 took place in 2018, and the lowest - 1 in 2014. The data has a rising trend.
The average number of deaths per 1,000 fires is 3. This indicator was the highest - 7 in 2018, and the lowest 0 in 2014. The trend for fatalities per 1,000 fire incidents is growing. Compared to the Oklahoma value the number of fatalities per 1,000 fire incidents is higher.
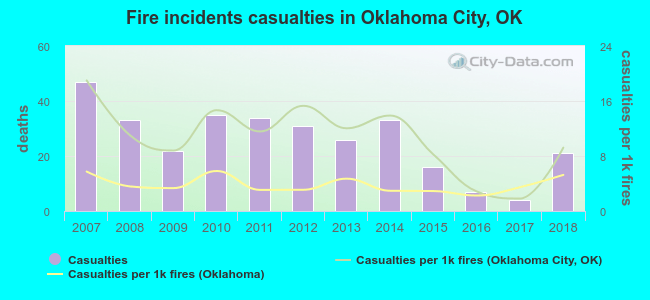 According to the data from the years 2007 - 2018 the average number of fire-related yearly casualties is 26. The highest number of reported injuries - 47 took place in 2007, and the lowest - 4 in 2017. The data has a dropping trend.
The average number of injuries per 1,000 fires is 11. This indicator was the highest - 19 in 2007, and the lowest 2 in 2017. The trend for injuries per 1,000 incidents is dropping. Compared to the state value the number of injuries per 1,000 fires is much higher.
According to the data from the years 2007 - 2018 the average number of fire-related yearly casualties is 26. The highest number of reported injuries - 47 took place in 2007, and the lowest - 4 in 2017. The data has a dropping trend.
The average number of injuries per 1,000 fires is 11. This indicator was the highest - 19 in 2007, and the lowest 2 in 2017. The trend for injuries per 1,000 incidents is dropping. Compared to the state value the number of injuries per 1,000 fires is much higher.Casualties per 1,000 incidents in Oklahoma City, OK compared to nearest cities:
(Note: Based on data for all years, including only cities with at least 500 fire incidents)
| Oklahoma City: | 10.7 |
| Warr Acres: | 1.4 |
| Del City: | 18.8 |
| Bethany: | 1.6 |
| The Village: | 3.4 |
| Midwest City: | 19.4 |
| Spencer: | 0.8 |
| Moore: | 22.1 |
| Yukon: | 4.1 |
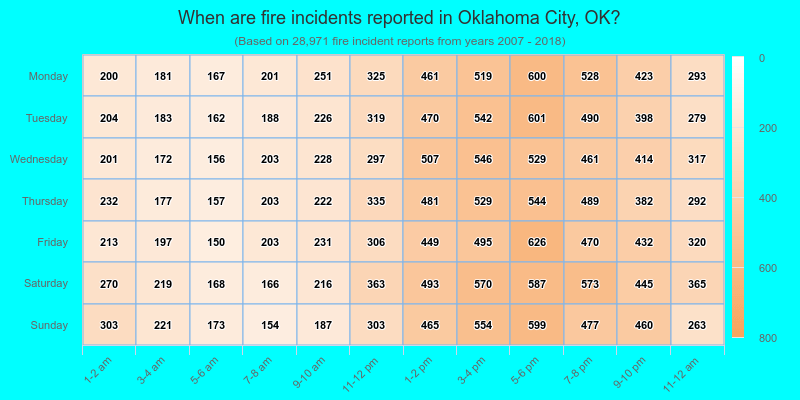
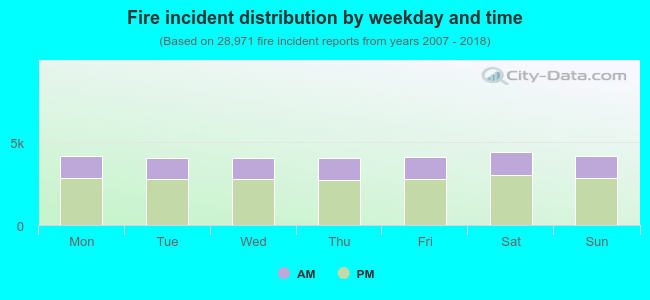 31.9% incidents where reported in the morning and 68.1% in the evening. The most fires (15.3%) took place on Saturday, and the least (13.9%) on Wednesday.
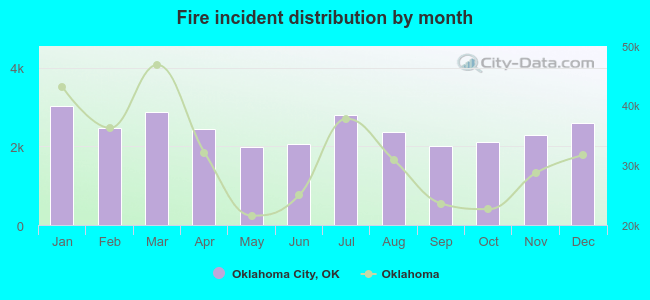 According to the 28,971 fires from years 2007 - 2018 most fires (10.5%) took place during January, and the least (6.9%) in May.
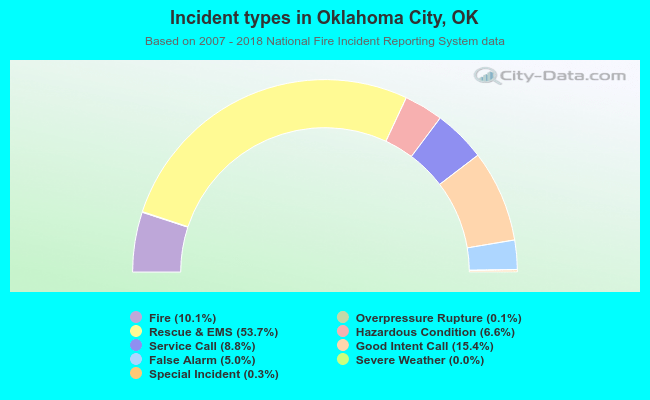 Out of all 287,872 cases reported during the years 2007 - 2018, the most belonged to the categories: Rescue & EMS (53.7%), Good Intent Call (15.4%), and Fire (10.1%).
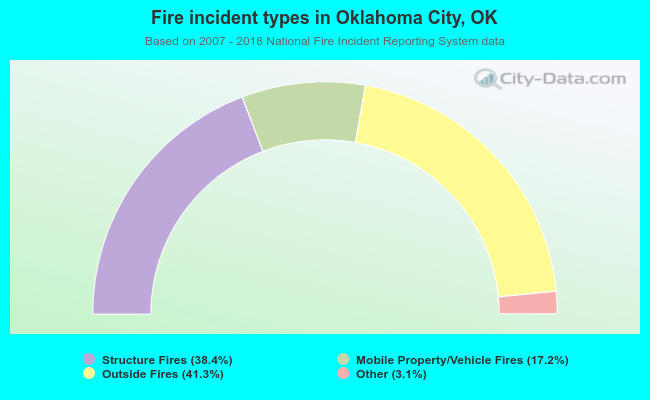 When looking into fire subcategories, the most reports belonged to: Outside Fires (41.3%), and Structure Fires (38.4%).