| Fire incidents reported |
|---|
| Sreet name | Count |
|---|
| FRONT ST | 12 | | STATE ROUTE 177 | 10 | | 1000 SOUTH FRONT ST | 6 | | CORD RD | 6 | | COVINGTON RD | 6 | | SAWMILL RD | 6 | | 15548 BOTTOM PRARIE RD. | 4 | | 309 IMMANUEL DR | 4 | | COUNTY HIGHWAY 12 | 4 | | COUNTY HWY 6 | 4 | | DOG ALLEY RD | 4 | | EB I-64 MM 38 | 4 | | FIELD NEAR COUNTY HWY 6 | 4 | | FRONTAGE RD | 4 | | GABRIEL LN | 4 | | HEN HOUSE RD | 4 | | I64 MM 41 | 4 | | ROAD RANGER | 4 | | 100 CHURCH ST | 2 | | 100 NORTH WASHINGTON | 2 | | 100 S. FRONT ST. | 2 | | 100 WASHINGTON AVE | 2 | | 1000 E. STARK | 2 | | 1000 S FRONT ST | 2 | | 1002 HIGH ST | 2 |
| | | Fire incidents reported |
|---|
| Sreet name | Count |
|---|
| 102 E. STATE ST. | 2 | | 102 SPRUCE | 2 | | 10496 STATE RT 177 | 2 | | 105 N FRONT ST | 2 | | 105 N FRONT ST. | 2 | | 1100 N. HENRIETTA | 2 | | 115 WEST CEDAR | 2 | | 11561 ORIOLE RD. | 2 | | 119 WEST CEDAR STREET | 2 | | 13597 RAILROAD ROAD | 2 | | 13886 RAIL ROAD ST. | 2 | | 1400 SPRING VALLEY DR | 2 | | 14537 CATTLE PEN RD | 2 | | 14736 HEN HOUSE RD. | 2 | | 14736 HEN HOUSE RD. | 2 | | 15548 BOTTOM PRAIRE RD. | 2 | | 1560 WATERWORKS RD. | 2 | | 158 S. MILL | 2 | | 15881 WATERWORKS RD. | 2 | | 1601 RAILROAD RD | 2 | | 17001 BLUE JAY RD. | 2 | | 17035 WATERWORKS RD | 2 | | 177 12 BEFORE I64 | 2 | | 177 AT DOLLAR GENERAL | 2 | | |
|
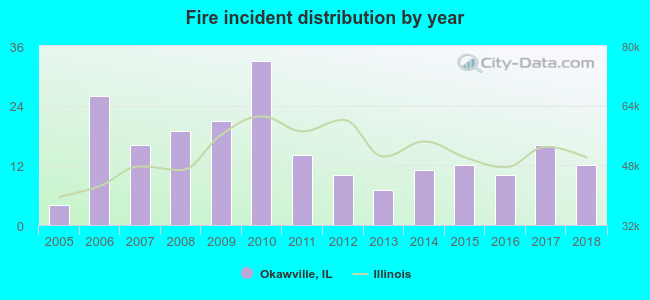 According to the data from the years 2005 - 2018 the average number of fire incidents per year is 15. The highest number of fire incidents - 33 took place in 2010, and the least - 4 in 2005. The data has a rising trend.
 37.4% incidents where reported in the morning and 62.6% in the evening. The most fires (19.0%) took place on Sunday, and the least (10.0%) on Wednesday.
 Based on the 211 fire incident reports from years 2005 - 2018 most fires (13.3%) took place during August, and the least (4.3%) in May.
 Out of all 903 cases reported during the years 2005 - 2018, the most belonged to the categories: Rescue & EMS (64.2%), Fire (23.4%), and Hazardous Condition (7.0%).
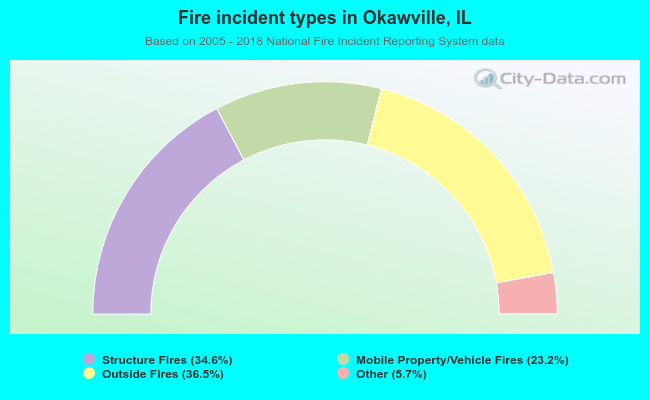 When looking into fire subcategories, the most incidents belonged to: Outside Fires (36.5%), and Structure Fires (34.6%).