Oglesby: Fire Incidents, Illinois (IL)
Where are fire incidents reported in Oglesby, IL
Something went wrong! Please refresh the page.
|
| |||||||||||||||||||||||||||||||||||||||||||||||||||||||||||||||||||||||||||||||||||||||||||||||||||||||||||||
2002 - 2018 National Fire Incident Reporting System (NFIRS) incidents
- Incident types reported to NFIRS in Oglesby, IL
- 45235.5%Hazardous Condition
- 38830.5%Fire
- 21817.1%Rescue & EMS
- 826.4%False Alarm
- 685.3%Service Call
- 483.8%Good Intent Call
- 70.5%Severe Weather
- 60.5%Special Incident
- 40.3%Overpressure Rupture
- Fire incident types reported to NFIRS in Oglesby, IL
- 15640.2%Structure Fires
- 12732.7%Outside Fires
- 6917.8%Mobile Property/Vehicle Fires
- 369.3%Other
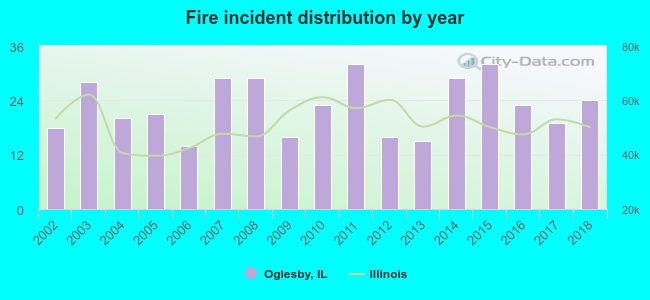 According to the data from the years 2002 - 2018 the average number of fire incidents per year is 23. The highest number of fire incidents - 32 took place in 2011, and the least - 14 in 2006. The data has a rising trend.
 Based on the data from the years 2002 - 2018 the average number of fire-related casualties per year is 0. The highest number of injuries - 3 took place in 2005, and the lowest - 0 in 2002. The data has a constant trend.
 33.0% incidents where reported in the morning and 67.0% in the evening. The most fires (18.6%) took place on Saturday, and the least (10.6%) on Sunday.
 According to the 388 incident reports from years 2002 - 2018 most fires (17.3%) took place during April, and the least (4.6%) in March.
 Out of all 1,273 cases reported during the years 2002 - 2018, the most belonged to the categories: Hazardous Condition (35.5%), Fire (30.5%), and Rescue & EMS (17.1%).
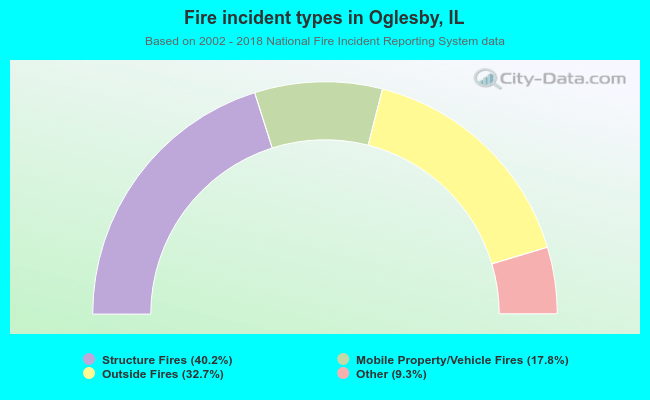 When looking into fire subcategories, the most reports belonged to: Structure Fires (40.2%), and Outside Fires (32.7%).