| Fire incidents reported |
|---|
| Sreet name | Count |
|---|
| POPLAR ST | 30 | | COMMUNITY BEACH RD | 24 | | MERRITT ST | 20 | | HOOTS CHAPEL RD | 18 | | FARTHING RD | 16 | | SOPER DR | 16 | | FERRYDALE RD | 12 | | ODIN RD | 12 | | WEST LINE RD | 12 | | EVERETT ST | 10 | | FARTHING ROAD RD | 10 | | KINGSHIGHWAY | 10 | | NORTON RD | 10 | | PERKINS | 10 | | RED STRIPE RD | 10 | | SOPER RD | 10 | | WOOD ST | 10 | | CHOUTEAU AVE | 8 | | CHOUTEAU DR | 8 | | DEWOLF ST | 8 | | EVERETT | 8 | | KIRKWOOD ST | 8 | | ODIN ROAD RD | 8 | | PERKINS ST | 8 | | FARTHING | 6 |
| | | Fire incidents reported |
|---|
| Sreet name | Count |
|---|
| HOOTS CHAPEL | 6 | | LINTON ST | 6 | | MERRITT DR | 6 | | RED STRIPE | 6 | | RED STRIPE ROAD RD | 6 | | SEVEN HILLS RD | 6 | | US HIGHWAY 50 HWY | 6 | | WORTBY ST | 6 | | ALMA HATCHERY RD | 4 | | BETHEL RD | 4 | | COMMUNITY BEACH | 4 | | COMMUNITY BEACH RD | 4 | | FRANKLIN AVE | 4 | | HIGHWAY 50 HWY | 4 | | HOOTS CHAPPEL ROAD | 4 | | LACLEDE AVE | 4 | | LAURY ST | 4 | | LINDELL AVE AVE | 4 | | LINDELL BLVD | 4 | | MAIN | 4 | | MAIN ST | 4 | | MARSHALL CREEK RD | 4 | | MERRITT STRE | 4 | | OAK ST | 4 | | |
|
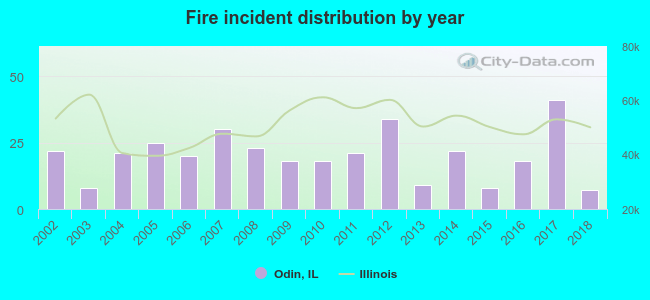 According to the data from the years 2002 - 2018 the average number of fire incidents per year is 20. The highest number of fire incidents - 41 took place in 2017, and the least - 7 in 2018. The data has a declining trend.
 22.9% incidents where reported in the morning and 77.1% in the evening. The most fires (16.8%) took place on Saturday, and the least (12.5%) on Sunday.
 Based on the 345 fire incident reports from years 2002 - 2018 most fires (13.9%) took place during March, and the least (4.1%) in September.
 Out of all 1,208 cases reported during the years 2002 - 2018, the most belonged to the categories: Rescue & EMS (57.4%), Fire (28.6%), and Hazardous Condition (5.9%).
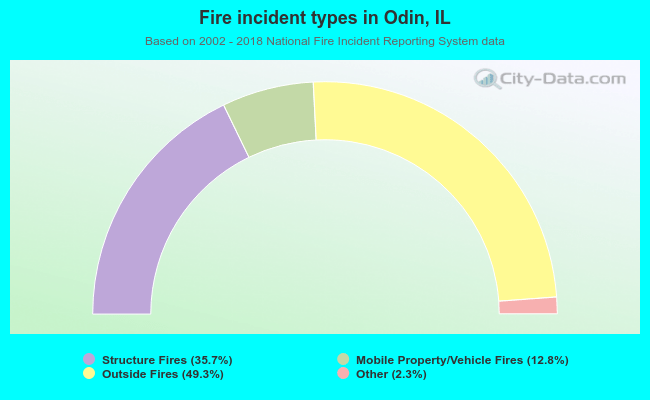 When looking into fire subcategories, the most incidents belonged to: Outside Fires (49.3%), and Structure Fires (35.7%).