| Fire incidents reported |
|---|
| Sreet name | Count |
|---|
| 2900 | 22 | | 75 HWY | 16 | | 75 HWY | 14 | | 31805 N 3940 DR. | 8 | | 75 | 8 | | HWY 75 | 8 | | 123 | 6 | | 2700 | 6 | | 2900 RD | 6 | | 3940 | 6 | | 200 S OCHELATA ST. | 4 | | 25 | 4 | | 28760 N 3960 RD. | 4 | | 29610 N 3950 RD | 4 | | 31805 N 3940 RD. | 4 | | 393301 W 2980 RD. | 4 | | 3945 RD | 4 | | 3952 | 4 | | 3954 | 4 | | 3960 | 4 | | 396811 W 2900 RD | 4 | | 397319 W 3000 RD. | 4 | | 3975 | 4 | | 3979 | 4 | | CR 2075 | 4 |
| | | Fire incidents reported |
|---|
| Sreet name | Count |
|---|
| HWY 75 AND 2500 RD. | 4 | | HWY 75 AND 2700 RD. | 4 | | HWY 75 AND 2800 RD. | 4 | | HWY 75 AND 3000 RD. | 4 | | MAIN ST | 4 | | OCHELATA | 4 | | WHY 123 | 4 | | WHY 75 AND 2500 RD. | 4 | | 100 N. OCHELATA | 2 | | 100 S LEBLANCE ST. | 2 | | 180 W COTTONWOOD AVE. | 2 | | 2003 | 2 | | 2007 | 2 | | 2007 W. OCHELATA | 2 | | 2075 | 2 | | 2075 RD AND 2007RD | 2 | | 212 N HOME ST. | 2 | | 225 N LEBLANC ST. | 2 | | 23000 RD | 2 | | 2400 & GAP RD | 2 | | 2400 AND 3950 AND 3960 | 2 | | 2400 AND 3950 AND3960 | 2 | | 2400 RD. AND CANEY RIVER | 2 | | 24041 W 3930 | 2 | | |
|
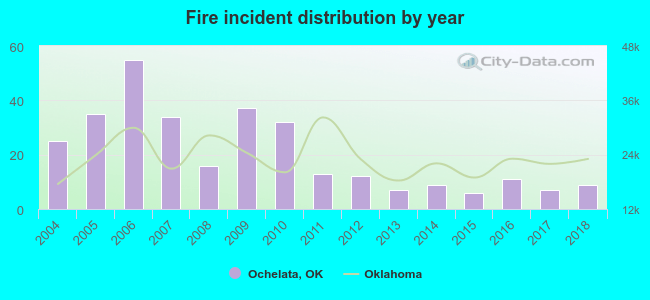 According to the data from the years 2004 - 2018 the average number of fires per year is 21. The highest number of fires - 55 took place in 2006, and the least - 6 in 2015. The data has a dropping trend.
 25.0% incidents where reported in the morning and 75.0% in the evening. The most fires (17.5%) took place on Saturday, and the least (10.4%) on Monday.
 Based on the 308 incident reports from years 2004 - 2018 most fires (21.4%) took place during March, and the least (3.2%) in May.
 Out of all 349 cases reported during the years 2004 - 2018, the most belonged to the categories: Fire (88.3%), Service Call (4.0%), and Overpressure Rupture (3.4%).
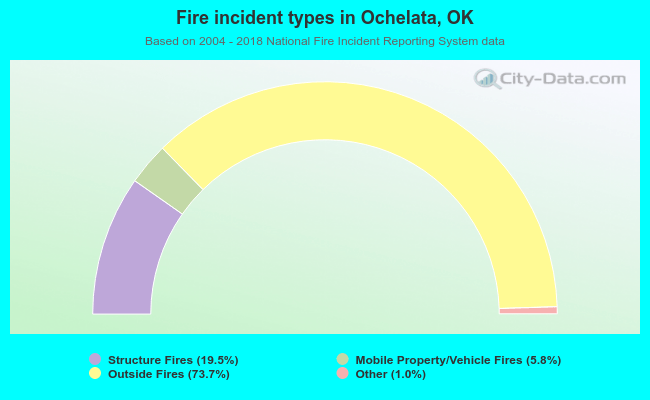 When looking into fire subcategories, the most reports belonged to: Outside Fires (73.7%), and Structure Fires (19.5%).