Oblong: Fire Incidents, Illinois (IL)
Where are fire incidents reported in Oblong, IL
Something went wrong! Please refresh the page.
|
| |||||||||||||||||||||||||||||||||||||||||||||||||||||||||||||||||||||||||||||||||||||||||||||||||||||||||||||
2002 - 2018 National Fire Incident Reporting System (NFIRS) incidents
- Incident types reported to NFIRS in Oblong, IL
- 30349.4%Fire
- 9816.0%Rescue & EMS
- 8413.7%Hazardous Condition
- 6310.3%Good Intent Call
- 294.7%Service Call
- 203.3%False Alarm
- 142.3%Severe Weather
- 20.3%Overpressure Rupture
- Fire incident types reported to NFIRS in Oblong, IL
- 13945.9%Outside Fires
- 12741.9%Structure Fires
- 3210.6%Mobile Property/Vehicle Fires
- 51.7%Other
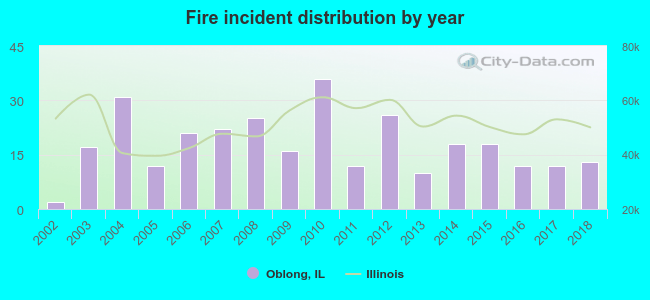 Based on the data from the years 2002 - 2018 the average number of fire incidents per year is 18. The highest number of reported fires - 36 took place in 2010, and the least - 2 in 2002. The data has an increasing trend.
 35.6% incidents where reported in the morning and 64.4% in the evening. The most fires (15.2%) took place on Wednesday, and the least (11.9%) on Sunday.
 According to the 303 reports from years 2002 - 2018 most fires (13.2%) took place during March, and the least (3.3%) in January.
 Out of all 613 cases reported during the years 2002 - 2018, the most belonged to the categories: Fire (49.4%), Rescue & EMS (16.0%), and Hazardous Condition (13.7%).
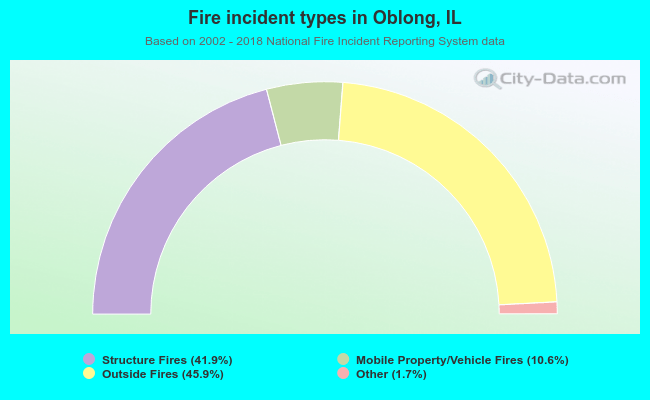 When looking into fire subcategories, the most reports belonged to: Outside Fires (45.9%), and Structure Fires (41.9%).