Oak View: Fire Incidents, California (CA)
Where are fire incidents reported in Oak View, CA
Something went wrong! Please refresh the page.
|
| |||||||||||||||||||||||||||||||||||||||||||||||||||||||||||||||||||||||||||||||||||||||||||||||||||||||||||||
2005 - 2018 National Fire Incident Reporting System (NFIRS) incidents
- Incident types reported to NFIRS in Oak View, CA
- 1,36359.9%Rescue & EMS
- 24910.9%Good Intent Call
- 24210.6%Service Call
- 2099.2%Fire
- 1466.4%Hazardous Condition
- 401.8%False Alarm
- 150.7%Severe Weather
- 80.4%Special Incident
- Fire incident types reported to NFIRS in Oak View, CA
- 8239.2%Outside Fires
- 6229.7%Structure Fires
- 3315.8%Other
- 3215.3%Mobile Property/Vehicle Fires
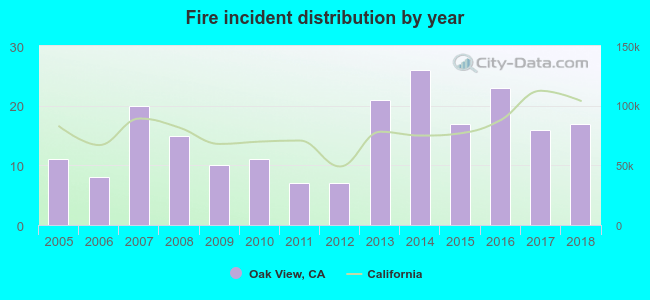 Based on the data from the years 2005 - 2018 the average number of fire incidents per year is 15. The highest number of reported fire incidents - 26 took place in 2014, and the least - 7 in 2011. The data has a rising trend.
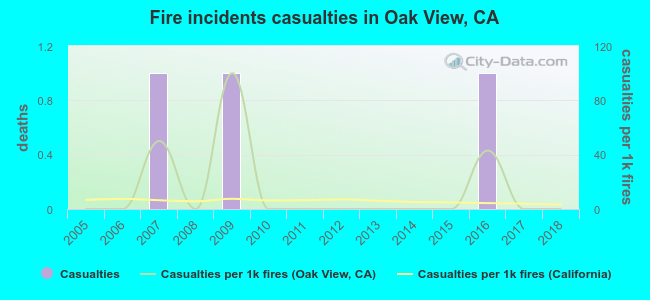 Based on the reports from the years 2005 - 2018 the average number of fire-related casualties per year is 0. The highest number of injuries - 1 took place in 2007, and the lowest - 0 in 2005. The data has a constant trend.
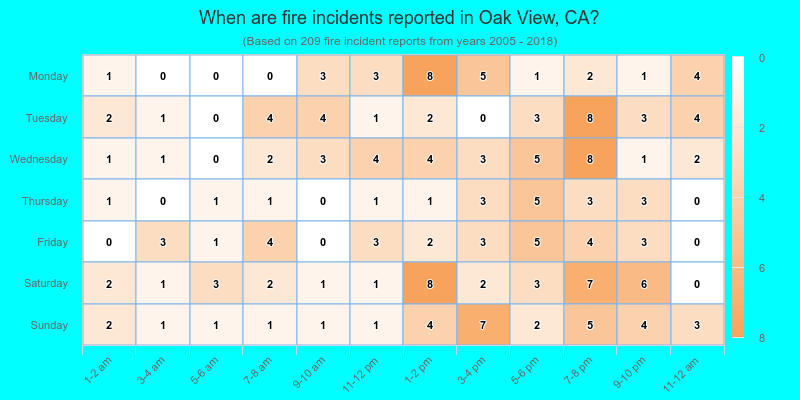
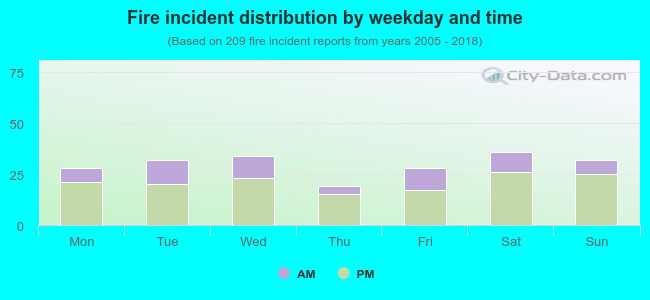 29.7% incidents where reported in the morning and 70.3% in the evening. The most fires (17.2%) took place on Saturday, and the least (9.1%) on Thursday.
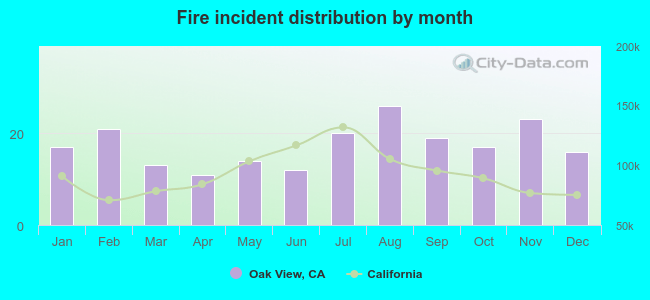 According to the 209 fires from years 2005 - 2018 most fires (12.4%) took place during August, and the least (5.3%) in April.
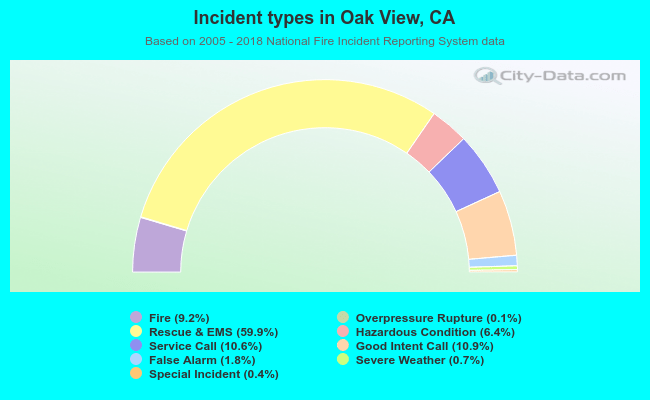 Out of all 2,274 cases reported during the years 2005 - 2018, the most belonged to the categories: Rescue & EMS (59.9%), Good Intent Call (10.9%), and Service Call (10.6%).
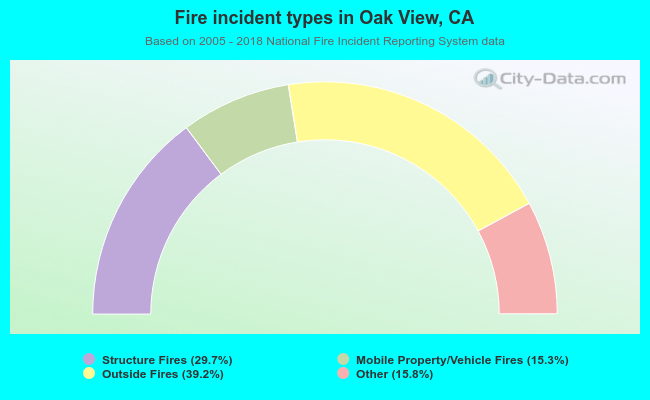 When looking into fire subcategories, the most reports belonged to: Outside Fires (39.2%), and Structure Fires (29.7%).