Nunn: Fire Incidents, Colorado (CO)
Where are fire incidents reported in Nunn, CO
Something went wrong! Please refresh the page.
|
| |||||||||||||||||||||||||||||||||||||||||||||||||||||||||||||||||||||||||||||||||||||||||||||||||||||||||||||
2005 - 2018 National Fire Incident Reporting System (NFIRS) incidents
- Incident types reported to NFIRS in Nunn, CO
- 17439.7%Fire
- 15435.2%Rescue & EMS
- 6414.6%Good Intent Call
- 204.6%False Alarm
- 194.3%Hazardous Condition
- 71.6%Service Call
- Fire incident types reported to NFIRS in Nunn, CO
- 12974.1%Outside Fires
- 2313.2%Structure Fires
- 1810.3%Mobile Property/Vehicle Fires
- 42.3%Other
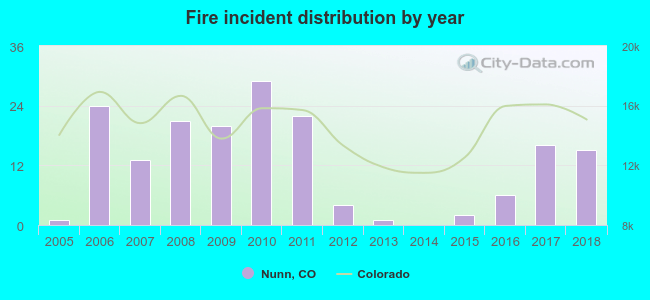 Based on the data from the years 2005 - 2018 the average number of fires per year is 12. The highest number of fire incidents - 29 took place in 2010, and the least - 0 in 2014. The data has an increasing trend.
 22.4% incidents where reported in the morning and 77.6% in the evening. The most fires (20.7%) took place on Sunday, and the least (9.2%) on Thursday.
 Based on the 174 reports from years 2005 - 2018 most fires (19.0%) took place during July, and the least (3.4%) in October.
 Out of all 438 cases reported during the years 2005 - 2018, the most belonged to the categories: Fire (39.7%), Overpressure Rupture (35.2%), and Service Call (14.6%).
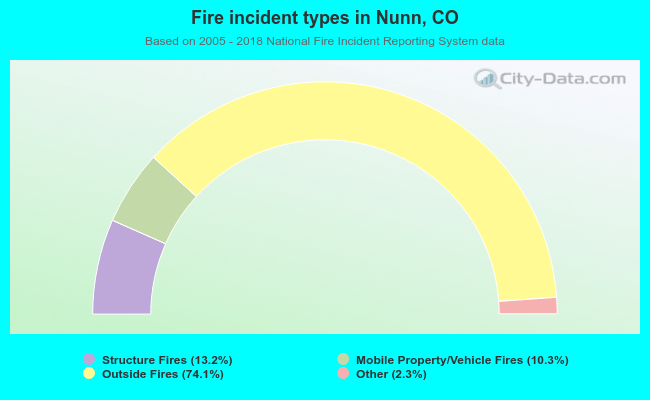 When looking into fire subcategories, the most incidents belonged to: Outside Fires (74.1%), and Structure Fires (13.2%).