| Fire incidents reported |
|---|
| Sreet name | Count |
|---|
| US 52 HWY | 34 | | MAIN ST | 28 | | WHITLEY ST | 28 | | SOUTH STANLY SCHOOL RD | 16 | | OLD AQUADALE RD | 14 | | PLANK RD | 14 | | WHITLEY RD | 14 | | ACORN ACRES RD | 12 | | ANSON AVE | 12 | | COTTONVILLE RD | 12 | | FORK RD | 12 | | KIMBERLY LN | 12 | | MT ZION CHURCH RD | 12 | | BETHLEHEM CHURCH RD | 10 | | NC 138 HWY | 10 | | CARVER ST | 8 | | KENDALL ST | 8 | | ATKINS AVE | 6 | | BECK CIR | 6 | | BOONE CAUDLE RD | 6 | | BRICKYARD RD | 6 | | CHAPEL RD | 6 | | DELAND DR | 6 | | DENNIS RD | 6 | | HARDY RD | 6 |
| | | Fire incidents reported |
|---|
| Sreet name | Count |
|---|
| INDIAN MOUND RD | 6 | | LOOP RD | 6 | | OLD COTTONVILLE RD | 6 | | PEE DEE AVE | 6 | | PRINCE RD | 6 | | QUAIL TRAIL RD | 6 | | RANDALLS FERRY RD | 6 | | ROCKY RIVER SPRINGS RD | 6 | | 12137 NC 138 HWY | 4 | | 310 BAY SHORE DR | 4 | | 32126 CHAPEL RD | 4 | | 34230 GEORGE RD | 4 | | 40212 HARDY RD | 4 | | 4407B FORK RD | 4 | | 8930 WHITLEY RD | 4 | | AIKMAN AVE | 4 | | ARROW HEAD RD | 4 | | BARRINGER CHAPEL RD | 4 | | BERRY HILL DR | 4 | | BOWERS RD | 4 | | BOWERSCRUMP RD | 4 | | EURY RD | 4 | | GADDYS FERRY RD | 4 | | HYDRO RD | 4 | | JAYCEE HUT RD | 4 |
|
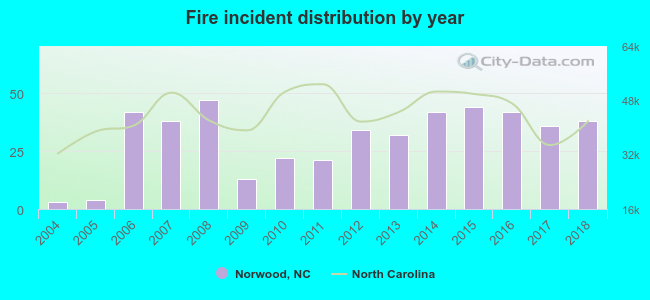 Based on the data from the years 2004 - 2018 the average number of fire incidents per year is 31. The highest number of reported fires - 47 took place in 2008, and the least - 3 in 2004. The data has a growing trend.
 30.3% incidents where reported in the morning and 69.7% in the evening. The most fires (18.3%) took place on Saturday, and the least (10.9%) on Monday.
 According to the 459 fires from years 2004 - 2018 most fires (12.0%) took place during January, and the least (4.8%) in July.
 Out of all 3,281 cases reported during the years 2004 - 2018, the most belonged to the categories: Rescue & EMS (56.1%), Good Intent Call (16.6%), and Fire (14.0%).
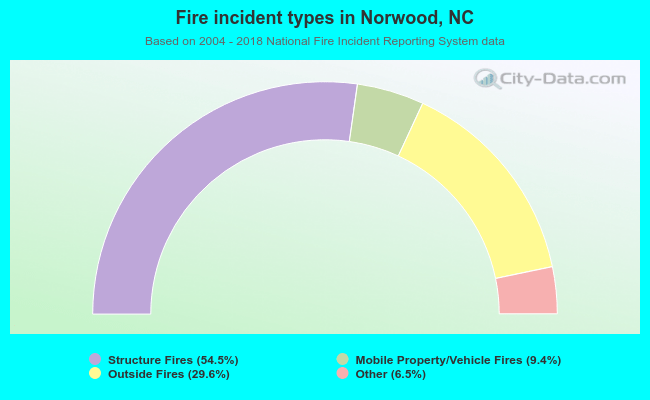 When looking into fire subcategories, the most incidents belonged to: Structure Fires (54.5%), and Outside Fires (29.6%).