| Fire incidents reported |
|---|
| Sreet name | Count |
|---|
| NORTH MAIN ST | 8 | | ROUTE 12 | 8 | | BEAN RD | 6 | | BEAR FARM RD | 6 | | COX BROOK RD | 6 | | WESTERN AVE | 6 | | 364 WHETSTONE DRIVE | 4 | | 762 BAILEY ROAD | 4 | | ASELTINE RD | 4 | | BERLIN POND RD | 4 | | CENTRAL ST | 4 | | HOLSTRUM RD | 4 | | MAIN STREET | 4 | | MILLERS FALLS | 4 | | PLEASANT ST | 4 | | ROUTE 12A | 4 | | RT 12 | 4 | | SMITH HILL RD | 4 | | SOUTH MAIN ST | 4 | | STONEY BROOK RD | 4 | | SUMMER ST | 4 | | TURKEY HILL RD | 4 | | UNION BROOK RD | 4 | | UNION ST | 4 | | VINE ST | 4 |
| | | Fire incidents reported |
|---|
| Sreet name | Count |
|---|
| VINE ST | 4 | | VINE STREET | 4 | | VT RT 12 | 4 | | VT RT 12 SOUTH | 4 | | 10 SPRING ST | 2 | | 101 DOLE HILL ROAD | 2 | | 1048 WEST HILL ROAD | 2 | | 105 KT LANE | 2 | | 108 VINE STREET | 2 | | 1086 N MAIN ST | 2 | | 1145 COX BROOK ROAD | 2 | | 1147 E ROXBURY RD | 2 | | 1147 EAST ROXBURY ROAD | 2 | | 1183 VT RT 12 SOUTH | 2 | | 1183 VT RT12 SOUTH | 2 | | 12 | 2 | | 122 NORTHVIEW DRIVE | 2 | | 1267 ROUTE 12 SOUTH | 2 | | 128 SLATE AVE | 2 | | 132 PLESANT ST | 2 | | 1334 WINCH HILL ROAD | 2 | | 135 CROSS ST | 2 | | 135 VINE STREET | 2 | | 1363 ROUTE 12 A | 2 | | |
|
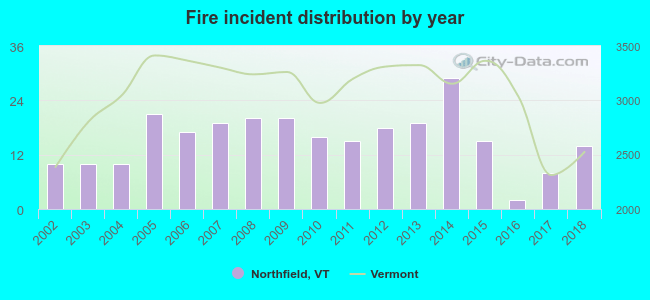 Based on the data from the years 2002 - 2018 the average number of fires per year is 15. The highest number of reported fires - 29 took place in 2014, and the least - 2 in 2016. The data has an increasing trend.
 35.7% incidents where reported in the morning and 64.3% in the evening. The most fires (15.6%) took place on Friday, and the least (12.9%) on Monday.
 Based on the 263 fires from years 2002 - 2018 most fires (14.8%) took place during May, and the least (3.0%) in October.
 Out of all 967 cases reported during the years 2002 - 2018, the most belonged to the categories: Rescue & EMS (40.0%), Fire (27.2%), and Overpressure Rupture (10.2%).
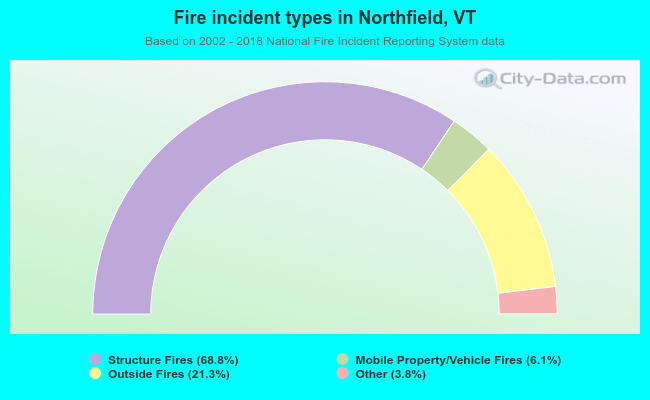 When looking into fire subcategories, the most reports belonged to: Structure Fires (68.8%), and Outside Fires (21.3%).