Northborough: Fire Incidents, Massachusetts (MA)
Where are fire incidents reported in Northborough, MA
Something went wrong! Please refresh the page.
| Fire incidents reported | |
|---|---|
| Sreet name | Count |
| SHOPS WAY | 76 |
| WEST MAIN ST. | 50 |
| MAIN ST. | 40 |
| RTE290 | 40 |
| WEST MAIN ST | 36 |
| HOWARD ST | 32 |
| OTIS ST | 32 |
| WEST MAIN ST | 30 |
| WHITNEY ST | 28 |
| SHOPS WAY | 26 |
| MAIN ST | 24 |
| RICE AVE | 24 |
| LYMAN ST | 20 |
| LYMAN ST | 20 |
| BARTLETT ST. | 18 |
| BALL ST. | 16 |
| CRAWFORD ST. | 14 |
| DAVIS ST | 14 |
| MAIN ST | 14 |
| OTIS ST. | 14 |
| SOUTH ST. | 14 |
| SOUTHWEST CUTOFF | 14 |
| BELMONT STRTE9 | 12 |
| GREEN ST | 12 |
| LYMAN ST. | 12 |
| RTE.290 | 12 |
| RTE.290 / CHURCH ST. | 12 |
| RTE.290 / SOLOMON POND RD. | 12 |
| SCHOOL ST | 12 |
| SOUTH ST | 12 |
| Other | 79 |
2002 - 2018 National Fire Incident Reporting System (NFIRS) incidents
- Incident types reported to NFIRS in Northborough, MA
- 5,81452.8%Rescue & EMS
- 1,40212.7%Service Call
- 1,35312.3%False Alarm
- 1,11810.2%Hazardous Condition
- 7717.0%Fire
- 4704.3%Good Intent Call
- 740.7%Special Incident
- Fire incident types reported to NFIRS in Northborough, MA
- 30839.9%Outside Fires
- 28537.0%Structure Fires
- 12716.5%Mobile Property/Vehicle Fires
- 516.6%Other
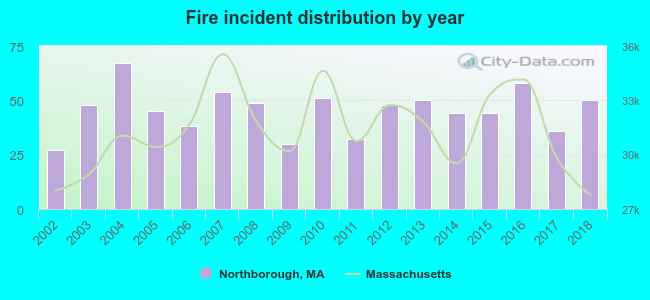 According to the data from the years 2002 - 2018 the average number of fire incidents per year is 45. The highest number of reported fire incidents - 67 took place in 2004, and the least - 27 in 2002. The data has a growing trend.
The average number of yearly fire incidents per 10k residents in Northborough, MA compared to nearest cities:
(Note: Based on data for the last 3 years, including only cities with population 5,000 and above)
| Northborough: | 77.8 |
| Shrewsbury: | 35.5 |
| Marlborough: | 31.4 |
| Southborough: | 38.6 |
| Hudson: | 44.1 |
| Grafton: | 8.1 |
| Clinton: | 88.9 |
| West Boylston: | 39.6 |
| Worcester: | 74.5 |
 The median response time based on all reported fire incidents is 6 minutes. This is higher than the state median value.
The median response time in Northborough, MA compared to nearest cities:
(Note: Based on data for all years, including only cities with at least 500 fire incidents)
| Northborough: | 6 minutes |
| Westborough: | 5 minutes |
| Shrewsbury: | 4 minutes |
| Marlborough: | 5 minutes |
| Southborough: | 6 minutes |
| Hudson: | 3 minutes |
| Clinton: | 3 minutes |
| Worcester: | 4 minutes |
| Hopkinton: | 6 minutes |
 Based on the data from the years 2002 - 2018 the average number of fire-related casualties per year is 1. The highest number of injuries - 5 took place in 2014, and the lowest - 0 in 2004. The data has a constant trend.
The average number of injuries per 1,000 fire incidents is 19. This indicator was the highest - 114 in 2014, and the lowest 0 in 2004. The trend for casualties per 1,000 fire incidents is dropping. Compared to the Massachusetts value the number of casualties per 1,000 fires is higher.
Based on the data from the years 2002 - 2018 the average number of fire-related casualties per year is 1. The highest number of injuries - 5 took place in 2014, and the lowest - 0 in 2004. The data has a constant trend.
The average number of injuries per 1,000 fire incidents is 19. This indicator was the highest - 114 in 2014, and the lowest 0 in 2004. The trend for casualties per 1,000 fire incidents is dropping. Compared to the Massachusetts value the number of casualties per 1,000 fires is higher.Casualties per 1,000 incidents in Northborough, MA compared to nearest cities:
(Note: Based on data for all years, including only cities with at least 500 fire incidents)
| Northborough: | 18.2 |
| Westborough: | 10.5 |
| Shrewsbury: | 3.4 |
| Marlborough: | 21.3 |
| Southborough: | 16.8 |
| Hudson: | 34.8 |
| Clinton: | 5.5 |
| Worcester: | 2.6 |
| Hopkinton: | 8.7 |
 29.3% incidents where reported in the morning and 70.7% in the evening. The most fires (16.2%) took place on Monday, and the least (12.7%) on Thursday.
 Based on the 771 fires from years 2002 - 2018 most fires (14.4%) took place during April, and the least (6.2%) in January.
 Out of all 11,014 cases reported during the years 2002 - 2018, the most belonged to the categories: Rescue & EMS (52.8%), Service Call (12.7%), and False Alarm (12.3%).
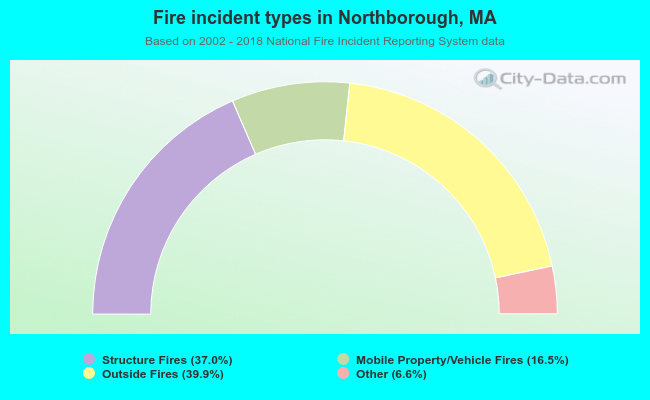 When looking into fire subcategories, the most incidents belonged to: Outside Fires (39.9%), and Structure Fires (37.0%).