North Webster: Fire Incidents, Indiana (IN)
Where are fire incidents reported in North Webster, IN
Something went wrong! Please refresh the page.
|
| |||||||||||||||||||||||||||||||||||||||||||||||||||||||||||||||||||||||||||||||||||||||||||||||||||||||||||||
2002 - 2017 National Fire Incident Reporting System (NFIRS) incidents
- Incident types reported to NFIRS in North Webster, IN
- 19432.2%Rescue & EMS
- 15125.0%Fire
- 13522.4%Hazardous Condition
- 437.1%Service Call
- 416.8%False Alarm
- 254.1%Good Intent Call
- 122.0%Special Incident
- 20.3%Severe Weather
- Fire incident types reported to NFIRS in North Webster, IN
- 7046.4%Structure Fires
- 5838.4%Outside Fires
- 1811.9%Mobile Property/Vehicle Fires
- 53.3%Other
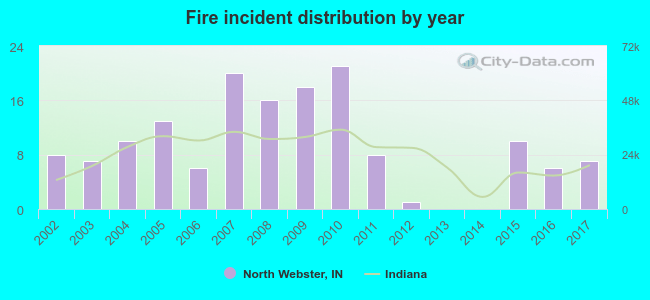 Based on the data from the years 2002 - 2017 the average number of fires per year is 9. The highest number of fire incidents - 21 took place in 2010, and the least - 0 in 2013. The data has a dropping trend.
 23.8% incidents where reported in the morning and 76.2% in the evening. The most fires (18.5%) took place on Thursday, and the least (7.3%) on Saturday.
 According to the 151 reports from years 2002 - 2017 most fires (13.9%) took place during April, and the least (3.3%) in May.
 Out of all 603 cases reported during the years 2002 - 2017, the most belonged to the categories: Overpressure Rupture (32.2%), Fire (25.0%), and Rescue & EMS (22.4%).
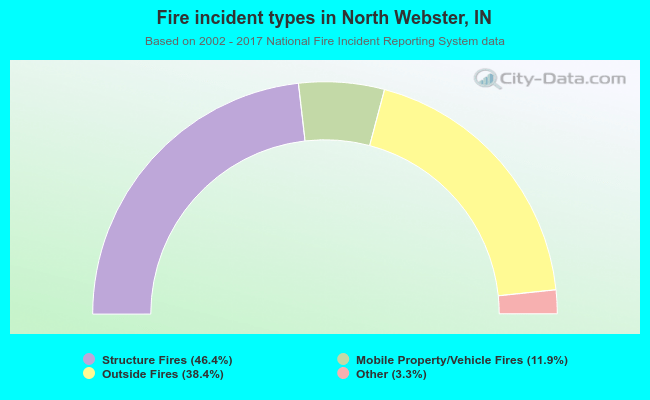 When looking into fire subcategories, the most reports belonged to: Structure Fires (46.4%), and Outside Fires (38.4%).