North: Fire Incidents, South Carolina (SC)
Where are fire incidents reported in North, SC
Something went wrong! Please refresh the page.
|
| |||||||||||||||||||||||||||||||||||||||||||||||||||||||||||||||||||||||||||||||||||||||||||||||||||||||||||||
2002 - 2018 National Fire Incident Reporting System (NFIRS) incidents
- Incident types reported to NFIRS in North, SC
- 1,12848.9%Fire
- 60526.2%Rescue & EMS
- 24610.7%Hazardous Condition
- 1506.5%Good Intent Call
- 753.3%Severe Weather
- 652.8%False Alarm
- 351.5%Service Call
- 30.1%Special Incident
- Fire incident types reported to NFIRS in North, SC
- 55649.3%Structure Fires
- 38834.4%Outside Fires
- 13812.2%Mobile Property/Vehicle Fires
- 464.1%Other
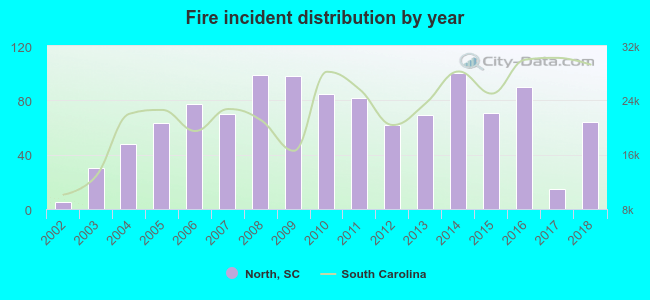 According to the data from the years 2002 - 2018 the average number of fires per year is 66. The highest number of reported fires - 100 took place in 2014, and the least - 5 in 2002. The data has a rising trend.
 The median response time based on all reported fire incidents is 9 minutes. This is higher than the South Carolina median value.
The median response time in North, SC compared to nearest cities:
(Note: Based on data for all years, including only cities with at least 500 fire incidents)
| North: | 9 minutes |
| Neeses: | 11 minutes |
| Swansea: | 8 minutes |
| Pelion: | 8 minutes |
| Gaston: | 8 minutes |
| Wagener: | 10 minutes |
| Orangeburg: | 5 minutes |
| Cordova: | 9 minutes |
| Cope: | 9 minutes |
 29.0% incidents where reported in the morning and 71.0% in the evening. The most fires (15.7%) took place on Sunday, and the least (11.5%) on Thursday.
 Based on the 1,128 reports from years 2002 - 2018 most fires (12.5%) took place during March, and the least (5.1%) in December.
 Out of all 2,307 cases reported during the years 2002 - 2018, the most belonged to the categories: Fire (48.9%), Overpressure Rupture (26.2%), and Rescue & EMS (10.7%).
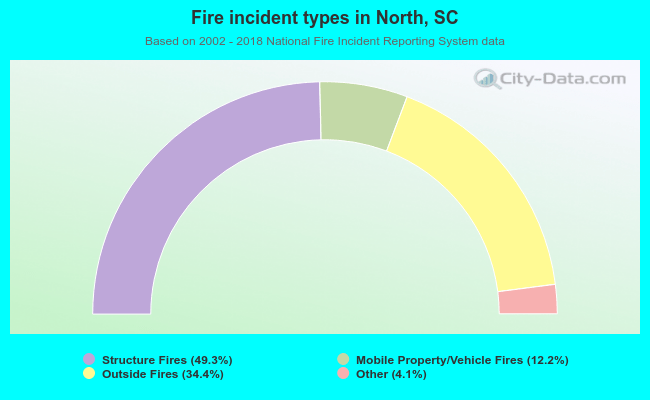 When looking into fire subcategories, the most reports belonged to: Structure Fires (49.3%), and Outside Fires (34.4%).