North Myrtle Beach: Fire Incidents, South Carolina (SC)
Where are fire incidents reported in North Myrtle Beach, SC
Something went wrong! Please refresh the page.
| Fire incidents reported | |
|---|---|
| Sreet name | Count |
| OCEAN BLVD | 806 |
| 17 HWY | 292 |
| HWY 17 | 246 |
| LITTLE RIVER NECK RD | 92 |
| HILLSIDE DR | 56 |
| 2ND AVE | 48 |
| SEA MOUNTAIN HWY | 46 |
| MAIN ST | 42 |
| SECOND AVE | 40 |
| PERRIN DR | 36 |
| POSSUM TROT RD | 36 |
| CATALINA DR | 32 |
| 1ST AVE | 24 |
| KINGS HWY | 24 |
| DAVID ST | 20 |
| FIRST AVE | 20 |
| OYSTER LN | 20 |
| SEAVIEW ST | 18 |
| 6TH AVE | 16 |
| CAROLINA BAYS PKY | 16 |
| MADISON DR | 16 |
| TIDEWATER DR | 16 |
| HOLLY DR | 14 |
| NIXON ST | 14 |
| OYSTER CATCHER DR | 14 |
| THOMAS AVE | 14 |
| 27TH AVE | 12 |
| 28TH AVE | 12 |
| 30TH AVE | 12 |
| 31ST AVE | 12 |
2002 - 2018 National Fire Incident Reporting System (NFIRS) incidents
- Incident types reported to NFIRS in North Myrtle Beach, SC
- 21,52764.5%Rescue & EMS
- 3,87711.6%False Alarm
- 2,5127.5%Good Intent Call
- 2,3697.1%Service Call
- 1,6484.9%Fire
- 1,3854.1%Hazardous Condition
- Fire incident types reported to NFIRS in North Myrtle Beach, SC
- 71843.6%Structure Fires
- 68341.4%Outside Fires
- 20412.4%Mobile Property/Vehicle Fires
- 432.6%Other
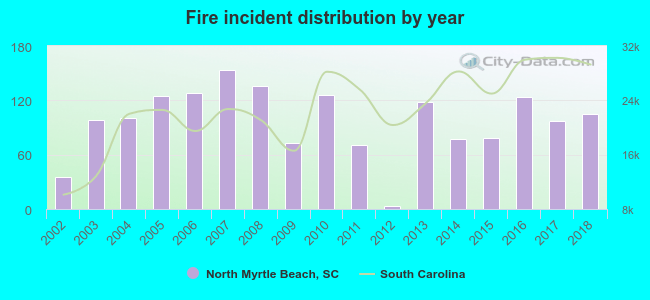 Based on the data from the years 2002 - 2018 the average number of fires per year is 97. The highest number of reported fires - 153 took place in 2007, and the least - 3 in 2012. The data has an increasing trend.
The average number of yearly fire incidents per 10k residents in North Myrtle Beach, SC compared to nearest cities:
(Note: Based on data for the last 3 years, including only cities with population 5,000 and above)
| North Myrtle Beach: | 71.6 |
| Little River: | 64.7 |
| Longs: | 97.8 |
| Myrtle Beach: | 152.6 |
| Conway: | 147.9 |
| Murrells Inlet: | 92.8 |
| Georgetown: | 172.3 |
| Marion: | 88.9 |
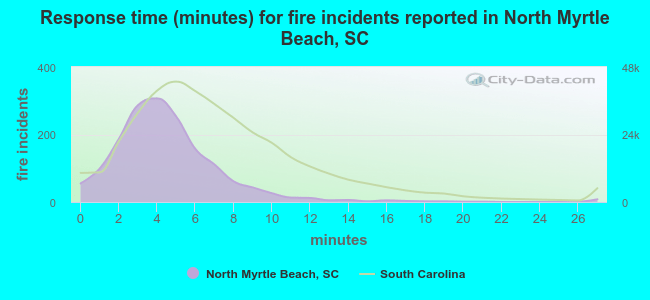 The median response time based on all reported fire incidents is 4 minutes. This is lower than the South Carolina median value.
The median response time in North Myrtle Beach, SC compared to nearest cities:
(Note: Based on data for all years, including only cities with at least 500 fire incidents)
| North Myrtle Beach: | 4 minutes |
| Little River: | 7 minutes |
| Calabash: | 9 minutes |
| Sunset Beach: | 8 minutes |
| Longs: | 10 minutes |
| Myrtle Beach: | 5 minutes |
| Ocean Isle Beach: | 8 minutes |
| Shallotte: | 8 minutes |
| Loris: | 9 minutes |
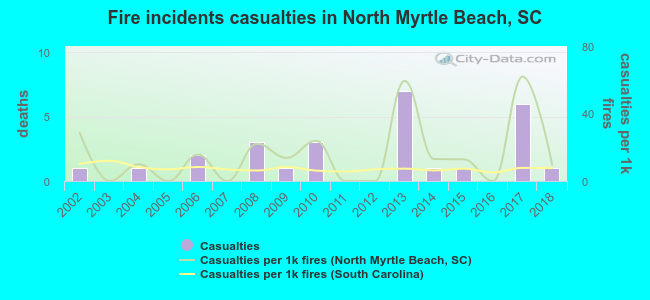 According to the reports from the years 2002 - 2018 the average number of fire-related yearly casualties is 2. The highest number of reported casualties - 7 took place in 2013, and the lowest - 0 in 2003. The data has a constant trend.
The average number of casualties per 1,000 fires is 16. This indicator was the highest - 62 in 2017, and the lowest 0 in 2003. The trend for injuries per 1,000 fire incidents is declining. Compared to the South Carolina value the number of injuries per 1,000 fire incidents is much higher.
According to the reports from the years 2002 - 2018 the average number of fire-related yearly casualties is 2. The highest number of reported casualties - 7 took place in 2013, and the lowest - 0 in 2003. The data has a constant trend.
The average number of casualties per 1,000 fires is 16. This indicator was the highest - 62 in 2017, and the lowest 0 in 2003. The trend for injuries per 1,000 fire incidents is declining. Compared to the South Carolina value the number of injuries per 1,000 fire incidents is much higher.Casualties per 1,000 incidents in North Myrtle Beach, SC compared to nearest cities:
(Note: Based on data for all years, including only cities with at least 500 fire incidents)
| North Myrtle Beach: | 16.4 |
| Little River: | 14.3 |
| Calabash: | 1.9 |
| Sunset Beach: | 6.9 |
| Longs: | 18.2 |
| Myrtle Beach: | 21.4 |
| Ocean Isle Beach: | 4.0 |
| Shallotte: | 1.3 |
| Loris: | 19.9 |
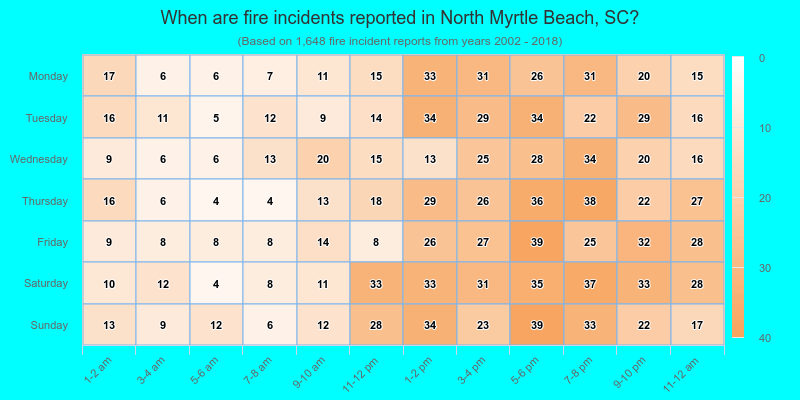
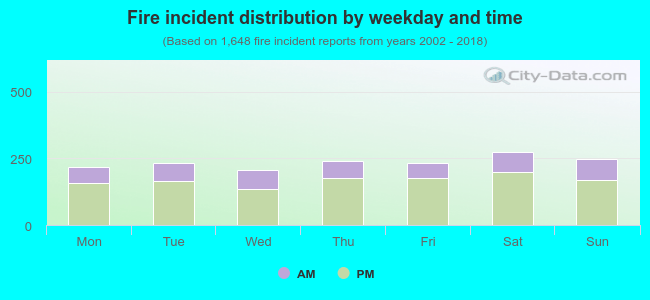 28.6% incidents where reported in the morning and 71.4% in the evening. The most fires (16.7%) took place on Saturday, and the least (12.4%) on Wednesday.
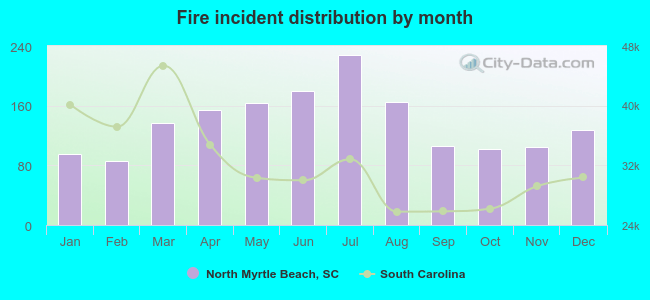 Based on the 1,648 incident reports from years 2002 - 2018 most fires (13.8%) took place during July, and the least (5.2%) in February.
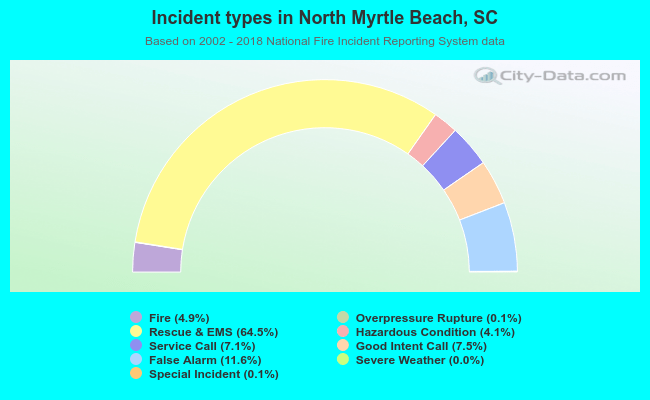 Out of all 33,380 cases reported during the years 2002 - 2018, the most belonged to the categories: Rescue & EMS (64.5%), False Alarm (11.6%), and Good Intent Call (7.5%).
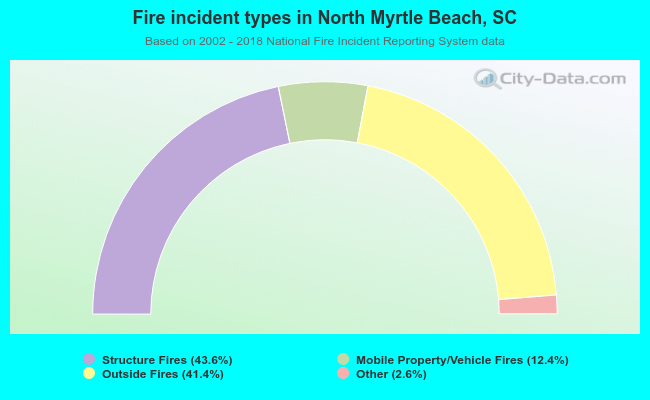 When looking into fire subcategories, the most reports belonged to: Structure Fires (43.6%), and Outside Fires (41.4%).