North Muskegon: Fire Incidents, Michigan (MI)
Where are fire incidents reported in North Muskegon, MI
Something went wrong! Please refresh the page.
|
| |||||||||||||||||||||||||||||||||||||||||||||||||||||||||||||||||||||||||||||||||||||||||||||||||||||||||||||
2002 - 2018 National Fire Incident Reporting System (NFIRS) incidents
- Incident types reported to NFIRS in North Muskegon, MI
- 88040.6%Rescue & EMS
- 42719.7%Hazardous Condition
- 35216.3%Fire
- 26812.4%Good Intent Call
- 1557.2%Service Call
- 683.1%False Alarm
- 110.5%Overpressure Rupture
- 40.2%Special Incident
- Fire incident types reported to NFIRS in North Muskegon, MI
- 16145.7%Structure Fires
- 11633.0%Outside Fires
- 5615.9%Mobile Property/Vehicle Fires
- 195.4%Other
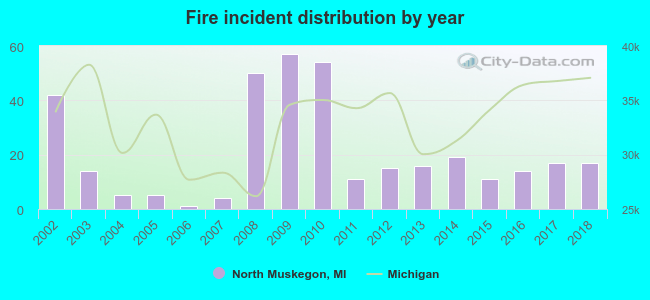 According to the data from the years 2002 - 2018 the average number of fires per year is 21. The highest number of fire incidents - 57 took place in 2009, and the least - 1 in 2006. The data has a decreasing trend.
 According to the data from the years 2002 - 2018 the average number of fire-related casualties per year is 0. The highest number of casualties - 2 took place in 2008, and the lowest - 0 in 2002. The data has a constant trend.
 29.3% incidents where reported in the morning and 70.7% in the evening. The most fires (17.6%) took place on Saturday, and the least (8.8%) on Thursday.
 Based on the 352 fire incident reports from years 2002 - 2018 most fires (16.5%) took place during April, and the least (3.7%) in August.
 Out of all 2,165 cases reported during the years 2002 - 2018, the most belonged to the categories: Rescue & EMS (40.6%), Hazardous Condition (19.7%), and Fire (16.3%).
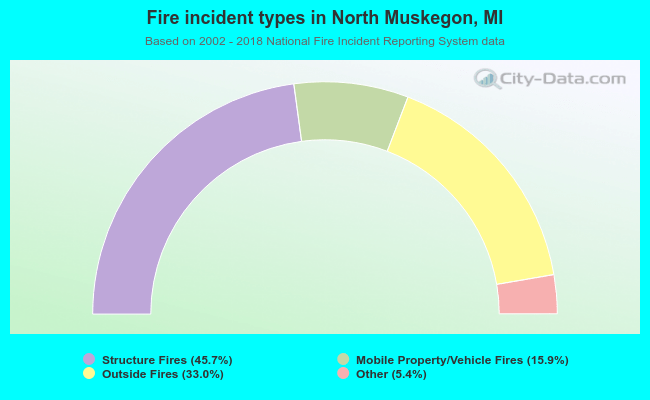 When looking into fire subcategories, the most reports belonged to: Structure Fires (45.7%), and Outside Fires (33.0%).