North Bend: Fire Incidents, Ohio (OH)
Where are fire incidents reported in North Bend, OH
Something went wrong! Please refresh the page.
|
| |||||||||||||||||||||||||||||||||||||||||||||||||||||||||||||||||||||||||||||||||||||||||||||||||||||||||||||
2002 - 2018 National Fire Incident Reporting System (NFIRS) incidents
- Incident types reported to NFIRS in North Bend, OH
- 34832.3%Fire
- 21019.5%Hazardous Condition
- 17015.8%Service Call
- 13712.7%Good Intent Call
- 13412.4%Rescue & EMS
- 666.1%False Alarm
- 80.7%Severe Weather
- 50.5%Special Incident
- Fire incident types reported to NFIRS in North Bend, OH
- 17249.4%Structure Fires
- 12836.8%Outside Fires
- 4512.9%Mobile Property/Vehicle Fires
- 30.9%Other
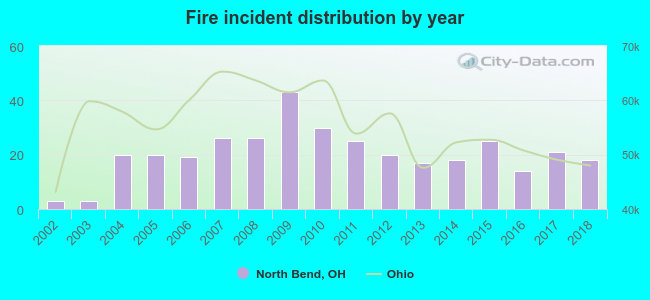 According to the data from the years 2002 - 2018 the average number of fires per year is 20. The highest number of fires - 43 took place in 2009, and the least - 3 in 2002. The data has an increasing trend.
 Based on the data from the years 2002 - 2018 the average number of fire-related yearly casualties is 0. The highest number of injuries - 1 took place in 2010, and the lowest - 0 in 2002. The data has a constant trend.
 27.0% incidents where reported in the morning and 73.0% in the evening. The most fires (19.5%) took place on Wednesday, and the least (10.1%) on Monday.
 Based on the 348 reports from years 2002 - 2018 most fires (12.9%) took place during March, and the least (5.2%) in August.
 Out of all 1,078 cases reported during the years 2002 - 2018, the most belonged to the categories: Fire (32.3%), Rescue & EMS (19.5%), and Hazardous Condition (15.8%).
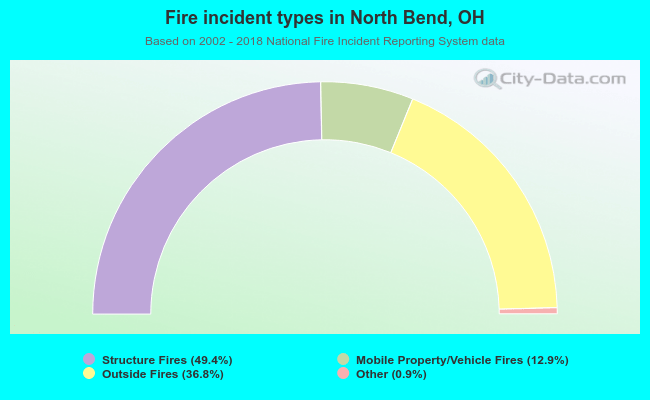 When looking into fire subcategories, the most reports belonged to: Structure Fires (49.4%), and Outside Fires (36.8%).