| Fire incidents reported |
|---|
| Sreet name | Count |
|---|
| 544 CO. RD. 500 N | 6 | | IL HWY 141 | 6 | | 106 CROSS STREET | 4 | | 583 CO. RD. 1050 E | 4 | | 587 CO RD 1040 E | 4 | | 589 CO RD 1040 E | 4 | | CO RD 500 E | 4 | | CO RD 975 E | 4 | | DIVISION ST | 4 | | EAST STREET | 4 | | ILLINOIS ROUTE 1 | 4 | | US HWY 45 | 4 | | US HWY 45 SOUTH | 4 | | 100 CO RD 1050 N | 2 | | 100 E. MAIN STREET | 2 | | 1000 E 541 N | 2 | | 102 CO ROAD 400 N | 2 | | 1030 CO RD 240N | 2 | | 104 EAST 4TH STREET | 2 | | 1047 CO. RD. N JCT | 2 | | 105 WEST SECOND ST | 2 | | 1050 EAST | 2 | | 1054 CO RD 600 E | 2 | | 106 S POWELL ST | 2 | | 106 SPENCE STREET | 2 |
| | | Fire incidents reported |
|---|
| Sreet name | Count |
|---|
| 107 WRIGHT STREET | 2 | | 127 CO. RD. 400 N | 2 | | 200 CO. RD. 300 E | 2 | | 200 CO. RD. 300 E. | 2 | | 200 E GOSSETT STREET | 2 | | 205 E FIFTH STREET | 2 | | 205 EAST ORCHARD STREET | 2 | | 207 SOUTH JOHNSON | 2 | | 208 EAST ORCHARD | 2 | | 209 E MAIN | 2 | | 211 E LOCUST | 2 | | 211 EAST MAIN ST | 2 | | 229 CO RD 500 E | 2 | | 24 CO. RD. 300 N | 2 | | 246 CO. RD. 600 E | 2 | | 262 HWY #1 | 2 | | 262 IL HWY 1 | 2 | | 264 CO. RD. 125 E | 2 | | 30 CO RD 300 N | 2 | | 300 SOUTH DIVISION ST | 2 | | 303 SOUTH FORREST | 2 | | 304 CO. RD. 700 N | 2 | | 304 CO. RD. 700 N RD | 2 | | 306 BROOKS DRIVE ST | 2 | | 306 E5TH | 2 |
|
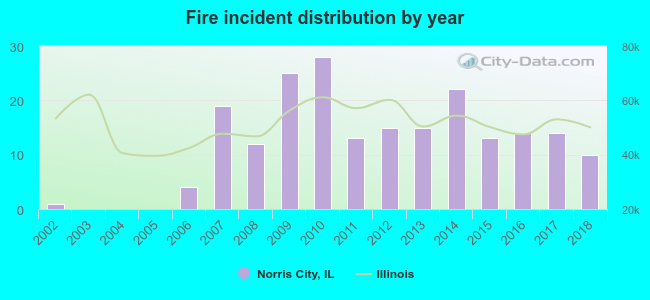 According to the data from the years 2002 - 2018 the average number of fire incidents per year is 12. The highest number of reported fires - 28 took place in 2010, and the least - 0 in 2003. The data has a rising trend.
 26.3% incidents where reported in the morning and 73.7% in the evening. The most fires (22.4%) took place on Tuesday, and the least (7.8%) on Wednesday.
 According to the 205 fire incident reports from years 2002 - 2018 most fires (15.1%) took place during March, and the least (3.4%) in July.
 Out of all 249 cases reported during the years 2002 - 2018, the most belonged to the categories: Fire (82.3%), Rescue & EMS (6.4%), and Service Call (4.8%).
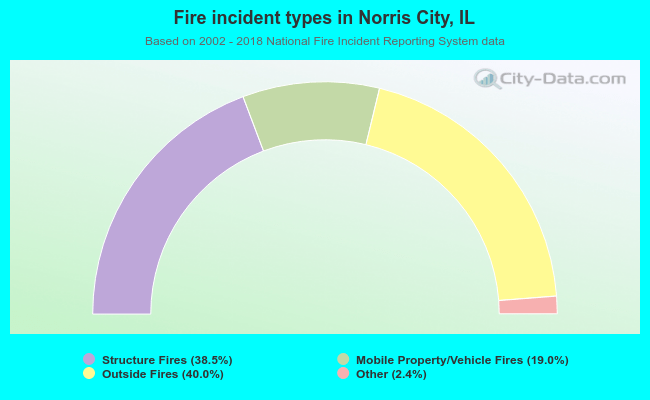 When looking into fire subcategories, the most incidents belonged to: Outside Fires (40.0%), and Structure Fires (38.5%).