| Fire incidents reported |
|---|
| Sreet name | Count |
|---|
| SHEID ROAD | 36 | | HWY 5 SOUTH | 24 | | HWY 341 | 16 | | HWY 5 | 14 | | CR 262 | 12 | | 5 HWY | 10 | | PUSH MOUNTAIN RD | 10 | | 329 MILDRED SIMPSON DRIVE | 8 | | CR 108 | 8 | | CR 73 | 8 | | HOPEWELL HOLLOW ROAD | 8 | | JORDAN ROAD | 8 | | 110 RONA LANE | 6 | | 198 VINEYARD LANE | 6 | | 2635 SHEID ROAD | 6 | | 320 CR 111 | 6 | | CR 227 | 6 | | CR 72 | 6 | | DWELLE ROAD | 6 | | RUSTIC RIDGE ROAD | 6 | | 1116 HAVNER ROAD | 4 | | 129 PEPPERTREE LANE | 4 | | 132 RIVER RANCH ROAD | 4 | | 15694 HWY 5 SOUTH | 4 | | 168 BLAIR FARM LANE | 4 |
| | | Fire incidents reported |
|---|
| Sreet name | Count |
|---|
| 186 FIRST STREET | 4 | | 19 WILD FERN LANE | 4 | | 1941 DWELLE RD | 4 | | 19865 HWY 5 SOUTH | 4 | | 232 PRIOLA LANE | 4 | | 269 JUBILEE TRAIL | 4 | | 2ND STREET | 4 | | 3615 NORFORK RIVER RD | 4 | | 40 BUCKEYE LANE | 4 | | 479 CR 72 | 4 | | 4TH STREET ST | 4 | | 79 CURBSTONE LANE | 4 | | 99 SHEID ROAD | 4 | | BLEVINS ST. ST | 4 | | BUCKEYE LANE | 4 | | CR 69 | 4 | | CR 71 | 4 | | FOURTH ST | 4 | | HWY 5 & 4TH STREET | 4 | | HWY 5 & SHEID ROAD | 4 | | MILDRED SIMPSON DRIVE | 4 | | NORFORK RIVER ROAD | 4 | | RIVER RIDGE ROAD RD | 4 | | SHEID RD | 4 | | |
|
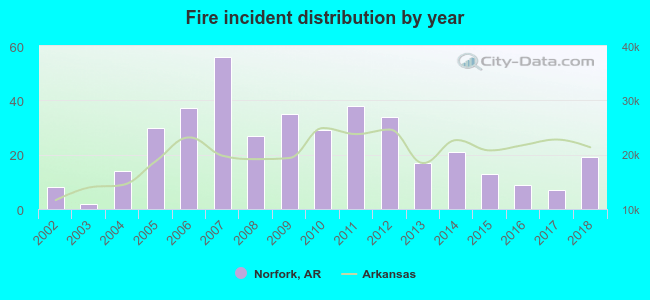 According to the data from the years 2002 - 2018 the average number of fire incidents per year is 23. The highest number of fires - 56 took place in 2007, and the least - 2 in 2003. The data has an increasing trend.
 26.0% incidents where reported in the morning and 74.0% in the evening. The most fires (17.7%) took place on Thursday, and the least (11.4%) on Sunday.
 According to the 396 fires from years 2002 - 2018 most fires (15.9%) took place during April, and the least (3.5%) in September.
 Out of all 1,039 cases reported during the years 2002 - 2018, the most belonged to the categories: Overpressure Rupture (56.1%), Fire (38.1%), and Service Call (2.0%).
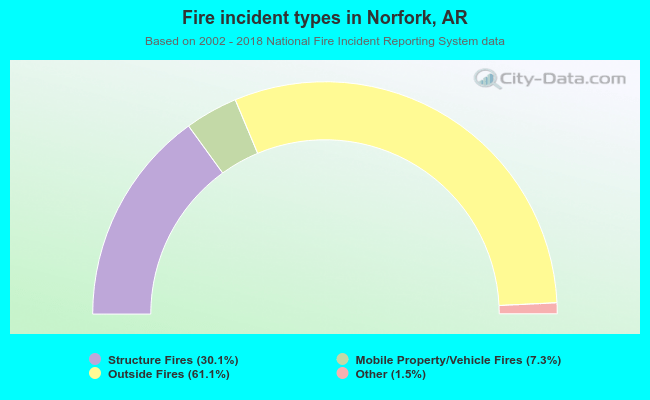 When looking into fire subcategories, the most incidents belonged to: Outside Fires (61.1%), and Structure Fires (30.1%).