Norco: Fire Incidents, Louisiana (LA)
Where are fire incidents reported in Norco, LA
Something went wrong! Please refresh the page.
|
| |||||||||||||||||||||||||||||||||||||||||||||||||||||||||||||||||||||||||||||||||||||||||||||||||||||||||||||
2002 - 2018 National Fire Incident Reporting System (NFIRS) incidents
- Incident types reported to NFIRS in Norco, LA
- 25829.1%Hazardous Condition
- 23526.5%Fire
- 15217.1%Good Intent Call
- 14316.1%Rescue & EMS
- 596.7%False Alarm
- 353.9%Service Call
- 50.6%Special Incident
- Fire incident types reported to NFIRS in Norco, LA
- 12854.5%Outside Fires
- 4920.9%Mobile Property/Vehicle Fires
- 4217.9%Structure Fires
- 166.8%Other
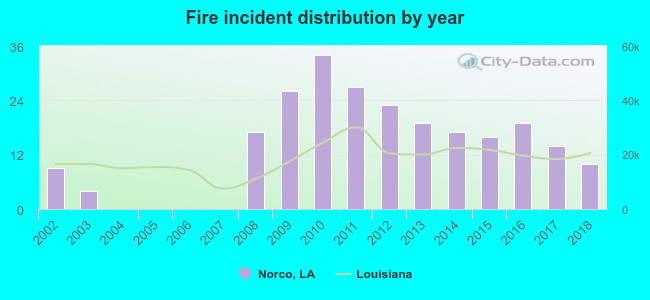 Based on the data from the years 2002 - 2018 the average number of fires per year is 14. The highest number of reported fire incidents - 34 took place in 2010, and the least - 0 in 2004. The data has a rising trend.
 29.8% incidents where reported in the morning and 70.2% in the evening. The most fires (20.9%) took place on Saturday, and the least (10.6%) on Wednesday.
 According to the 235 fires from years 2002 - 2018 most fires (15.7%) took place during February, and the least (2.6%) in May.
 Out of all 887 cases reported during the years 2002 - 2018, the most belonged to the categories: Rescue & EMS (29.1%), Fire (26.5%), and Service Call (17.1%).
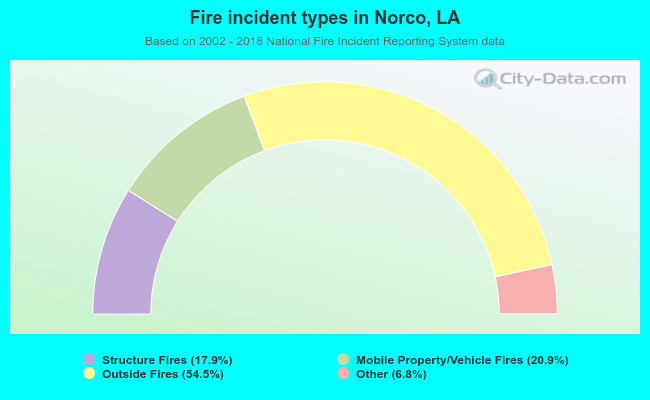 When looking into fire subcategories, the most incidents belonged to: Outside Fires (54.5%), and Mobile Property/Vehicle Fires (20.9%).