Nokomis: Fire Incidents, Illinois (IL)
Where are fire incidents reported in Nokomis, IL
Something went wrong! Please refresh the page.
|
| |||||||||||||||||||||||||||||||||||||||||||||||||||||||||||||||||||||||||||||||||||||||||||||||||||||||||||||
| Other | 12 | |||||||||||||||||||||||||||||||||||||||||||||||||||||||||||||||||||||||||||||||||||||||||||||||||||||||||||||
2004 - 2018 National Fire Incident Reporting System (NFIRS) incidents
- Incident types reported to NFIRS in Nokomis, IL
- 34653.8%Fire
- 13521.0%Rescue & EMS
- 8513.2%Hazardous Condition
- 294.5%Good Intent Call
- 243.7%False Alarm
- 203.1%Service Call
- 30.5%Special Incident
- 10.2%Severe Weather
- Fire incident types reported to NFIRS in Nokomis, IL
- 20860.1%Structure Fires
- 9527.5%Outside Fires
- 339.5%Mobile Property/Vehicle Fires
- 102.9%Other
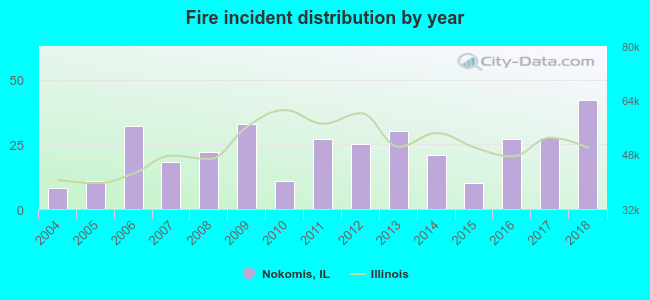 According to the data from the years 2004 - 2018 the average number of fire incidents per year is 23. The highest number of reported fires - 42 took place in 2018, and the least - 8 in 2004. The data has a rising trend.
 33.2% incidents where reported in the morning and 66.8% in the evening. The most fires (21.4%) took place on Sunday, and the least (6.9%) on Thursday.
 According to the 346 fire incident reports from years 2004 - 2018 most fires (13.3%) took place during February, and the least (5.2%) in June.
 Out of all 643 cases reported during the years 2004 - 2018, the most belonged to the categories: Fire (53.8%), Overpressure Rupture (21.0%), and Rescue & EMS (13.2%).
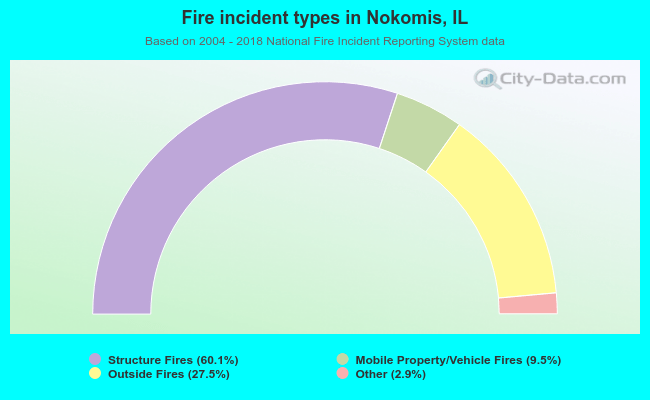 When looking into fire subcategories, the most incidents belonged to: Structure Fires (60.1%), and Outside Fires (27.5%).