Niantic: Fire Incidents, Illinois (IL)
Where are fire incidents reported in Niantic, IL
Something went wrong! Please refresh the page.
|
| |||||||||||||||||||||||||||||||||||||||||||||||||||||||||||||||||||||||||||||||||||||||||||||||||||||||||||||
2002 - 2018 National Fire Incident Reporting System (NFIRS) incidents
- Incident types reported to NFIRS in Niantic, IL
- 28935.9%Fire
- 24730.7%Rescue & EMS
- 9011.2%Hazardous Condition
- 8410.4%Good Intent Call
- 455.6%Service Call
- 232.9%False Alarm
- 232.9%Severe Weather
- 40.5%Special Incident
- Fire incident types reported to NFIRS in Niantic, IL
- 13346.0%Outside Fires
- 12242.2%Structure Fires
- 279.3%Mobile Property/Vehicle Fires
- 72.4%Other
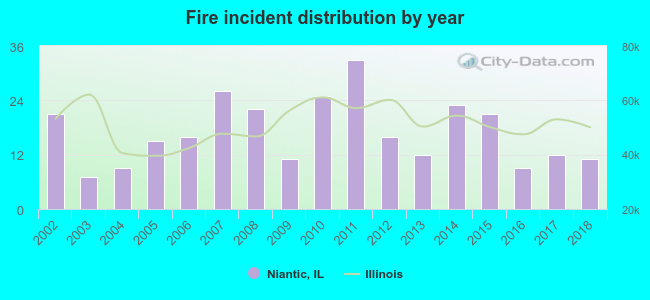 According to the data from the years 2002 - 2018 the average number of fire incidents per year is 17. The highest number of fires - 33 took place in 2011, and the least - 7 in 2003. The data has a declining trend.
 29.8% incidents where reported in the morning and 70.2% in the evening. The most fires (19.0%) took place on Friday, and the least (10.7%) on Wednesday.
 According to the 289 fire incidents from years 2002 - 2018 most fires (12.8%) took place during March, and the least (4.5%) in August.
 Out of all 805 cases reported during the years 2002 - 2018, the most belonged to the categories: Fire (35.9%), Overpressure Rupture (30.7%), and Rescue & EMS (11.2%).
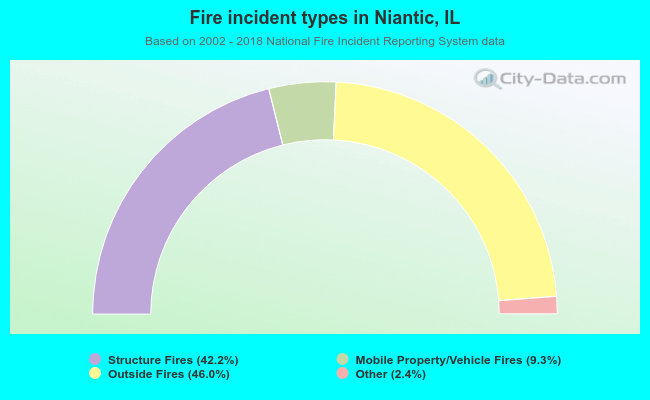 When looking into fire subcategories, the most incidents belonged to: Outside Fires (46.0%), and Structure Fires (42.2%).