| Fire incidents reported |
|---|
| Sreet name | Count |
|---|
| EAGLE RD | 46 | | STATE ST | 36 | | SWAMP RD | 34 | | LINCOLN AVE | 24 | | LANGHORNE NEWTOWN RD | 16 | | RICHBORO RD | 14 | | CAMBRIDGE LN | 12 | | CONGRESS ST | 12 | | LOWER DOLINGTON RD | 12 | | SYCAMORE ST | 12 | | DURHAM RD | 10 | | LINTON HILL RD | 10 | | PHEASANT RUN RD | 10 | | WEST RD | 10 | | BARCLAY ST | 8 | | PHEASANT RUN | 8 | | SOCIETY PL | 8 | | STOOPVILLE RD | 8 | | UNIVERSITY DR | 8 | | HIGHLAND RD | 6 | | LEEDOM WAY | 6 | | STONEYBROOK RD | 6 | | UPPER SILVER LAKE RD | 6 | | WEST CHESTER PIKE | 6 | | ALEXANDER WAY | 4 |
| | | Fire incidents reported |
|---|
| Sreet name | Count |
|---|
| AUTUMN DR | 4 | | BRECKNOCK CT | 4 | | BUCK RD | 4 | | BUCKMANVILLE RD | 4 | | CHANCELLOR ST | 4 | | CROCUS LN | 4 | | DELAWARE CT | 4 | | DIAMOND DR | 4 | | EDGEBORO DR | 4 | | FROST LN | 4 | | JEFFERSON CT | 4 | | MAPLE AVE | 4 | | MILFORD CT | 4 | | MOUNTAIN13 RD | 4 | | NEWTOWN STREET RD | 4 | | NEWTOWN YARDLEY RD | 4 | | PHEASANT RUN | 4 | | SHERMANS MOUNTAIN (12) RD | 4 | | SKYVIEW WAY | 4 | | SOUTH DR | 4 | | SOUTH EAGLE RD | 4 | | SUMMIT TRACE RD | 4 | | TAYLORSVILLE RD | 4 | | TERRY DR | 4 | | |
|
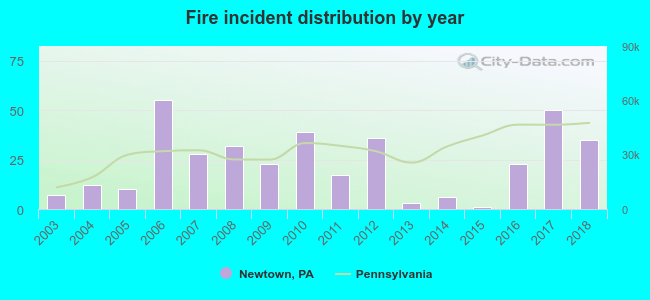 According to the data from the years 2003 - 2018 the average number of fires per year is 24. The highest number of reported fire incidents - 55 took place in 2006, and the least - 1 in 2015. The data has a rising trend.
 37.9% incidents where reported in the morning and 62.1% in the evening. The most fires (19.1%) took place on Monday, and the least (6.1%) on Sunday.
 Based on the 377 fire incidents from years 2003 - 2018 most fires (12.7%) took place during April, and the least (5.0%) in November.
 Out of all 3,124 cases reported during the years 2003 - 2018, the most belonged to the categories: Rescue & EMS (43.1%), False Alarm (16.2%), and Good Intent Call (15.8%).
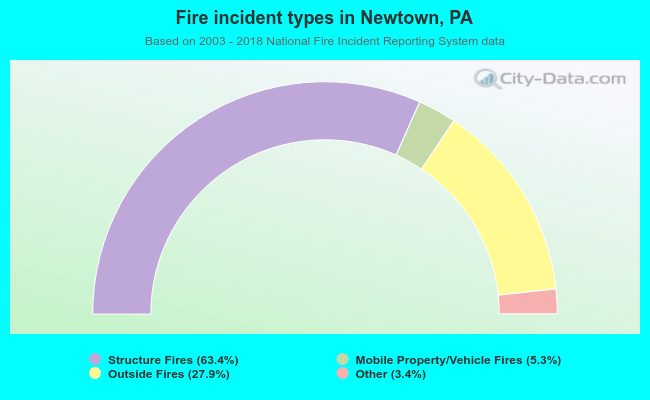 When looking into fire subcategories, the most reports belonged to: Structure Fires (63.4%), and Outside Fires (27.9%).