Newton: Fire Incidents, New Jersey (NJ)
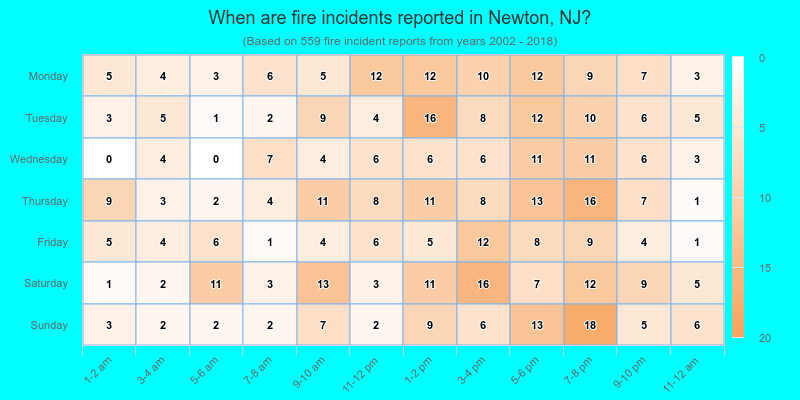
Where are fire incidents reported in Newton, NJ
Something went wrong! Please refresh the page.
|
| |||||||||||||||||||||||||||||||||||||||||||||||||||||||||||||||||||||||||||||||||||||||||||||||||||||||||||||
2002 - 2018 National Fire Incident Reporting System (NFIRS) incidents
- Incident types reported to NFIRS in Newton, NJ
- 62126.8%False Alarm
- 61726.7%Hazardous Condition
- 55924.2%Fire
- 2129.2%Service Call
- 1647.1%Rescue & EMS
- 642.8%Good Intent Call
- 512.2%Special Incident
- 170.7%Severe Weather
- 90.4%Overpressure Rupture
- Fire incident types reported to NFIRS in Newton, NJ
- 36765.7%Structure Fires
- 12121.6%Outside Fires
- 376.6%Mobile Property/Vehicle Fires
- 346.1%Other
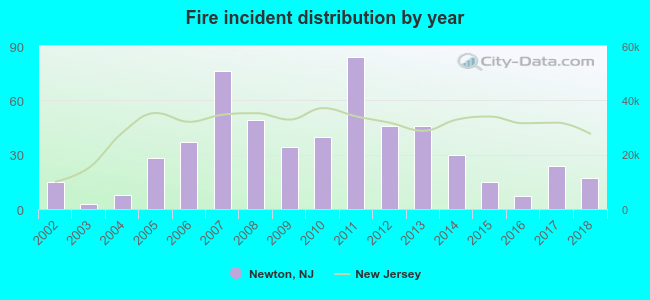 According to the data from the years 2002 - 2018 the average number of fire incidents per year is 33. The highest number of fires - 84 took place in 2011, and the least - 3 in 2003. The data has a rising trend.
The average number of yearly fire incidents per 10k residents in Newton, NJ compared to nearest cities:
(Note: Based on data for the last 3 years, including only cities with population 5,000 and above)
| Newton: | 20.3 |
| Hopatcong: | 7.3 |
| Mount Arlington: | 23.7 |
| Budd Lake: | 78.4 |
| Wharton: | 24.2 |
| Succasunna: | 19.3 |
| Hackettstown: | 32.5 |
| Dover: | 64.8 |
| Rockaway: | 57.6 |
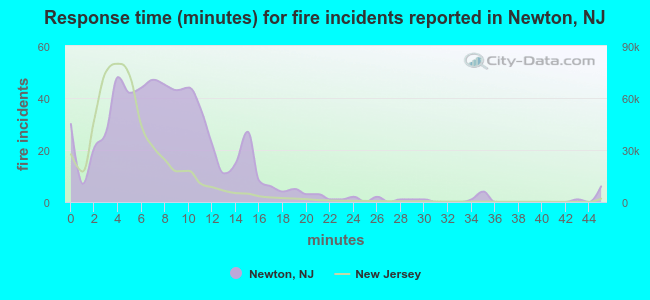 The median response time based on all reported fire incidents is 8 minutes. This is higher than the New Jersey median value.
The median response time in Newton, NJ compared to nearest cities:
(Note: Based on data for all years, including only cities with at least 500 fire incidents)
| Newton: | 8 minutes |
| Budd Lake: | 0 minutes |
| Hackettstown: | 6 minutes |
| Dover: | 3 minutes |
| Rockaway: | 8 minutes |
| Long Valley: | 10 minutes |
| West Milford: | 6 minutes |
| Kinnelon: | 5 minutes |
| Morris Plains: | 4 minutes |
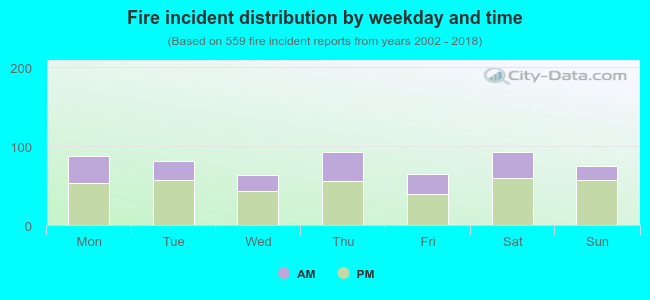 34.7% incidents where reported in the morning and 65.3% in the evening. The most fires (16.6%) took place on Thursday, and the least (11.4%) on Wednesday.
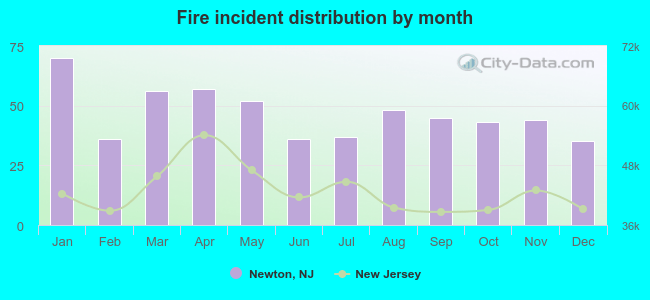 According to the 559 reports from years 2002 - 2018 most fires (12.5%) took place during January, and the least (6.3%) in December.
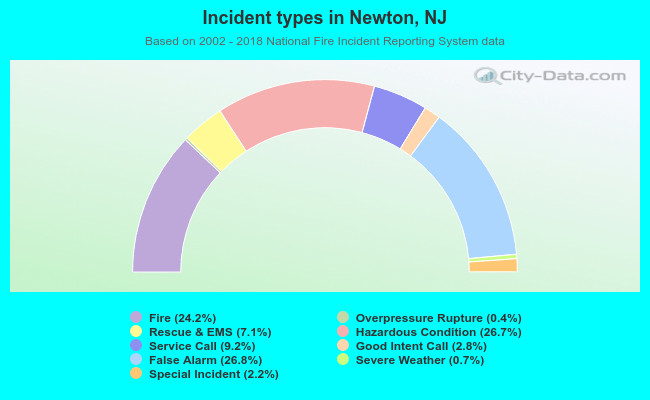 Out of all 2,314 cases reported during the years 2002 - 2018, the most belonged to the categories: False Alarm (26.8%), Hazardous Condition (26.7%), and Fire (24.2%).
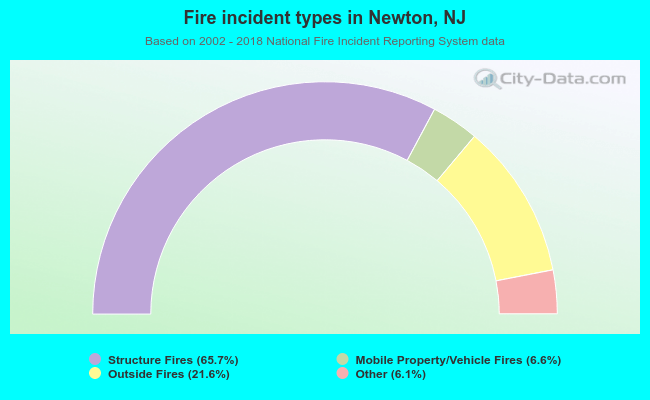 When looking into fire subcategories, the most incidents belonged to: Structure Fires (65.7%), and Outside Fires (21.6%).