| Fire incidents reported |
|---|
| Sreet name | Count |
|---|
| GLEN RD | 14 | | MAIN ST | 10 | | WESTERN AVE | 10 | | 107 MAIN STREET | 8 | | 115 COLUMBIA WAY | 8 | | CLYDE ST | 8 | | MAIN STREET | 8 | | UNION ST | 8 | | FIELD AVE | 6 | | PLEASANT STREET | 6 | | RAILROAD SQ | 6 | | 100 MAIN ST | 4 | | 107 MAIN ST | 4 | | 236 PLEASANT ST | 4 | | 25 EASTERN AVE | 4 | | 252 HIGHLAND AVE | 4 | | 268 MEADOW LANE | 4 | | 29 COTTAGE ST | 4 | | 47 LANDING ST | 4 | | 47 LANDING STREET | 4 | | 587 LAKE RD | 4 | | ALDERBROOK RD | 4 | | COLUMBIA WAY | 4 | | COVENTRY ST | 4 | | COVENTRY STREET | 4 |
| | | Fire incidents reported |
|---|
| Sreet name | Count |
|---|
| CROSS STREET | 4 | | EAST MAIN ST | 4 | | ELM ST | 4 | | FYFE DRIVE | 4 | | GARDNER PARK | 4 | | LAKE RD | 4 | | OAK ST | 4 | | VETERANS AVE | 4 | | 100 MAIN STREET | 2 | | 102 OUTLOOK ST | 2 | | 103 KENT LANE | 2 | | 103 MAIN ST | 2 | | 106 MCNEAL HEIGHTS | 2 | | 108 THIRD ST LGTS | 2 | | 108 THIRD STREET | 2 | | 111 CENTRAL ST | 2 | | 113 STAGECOACH DR | 2 | | 115 COLUMBIA WAY LGTS | 2 | | 115 PROSPECT STREET | 2 | | 1160 LAKE RAOD | 2 | | 118 CENTRAL ST | 2 | | 119 HINMAN STREET | 2 | | 12 NORTHERN AVE AVE | 2 | | 122 PLEASANT STREET | 2 | | |
|
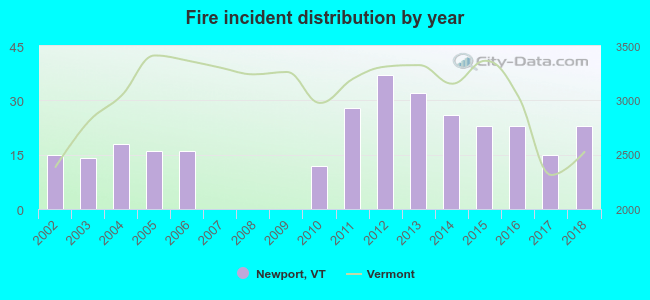 Based on the data from the years 2002 - 2018 the average number of fires per year is 18. The highest number of reported fires - 37 took place in 2012, and the least - 0 in 2007. The data has an increasing trend.
 34.6% incidents where reported in the morning and 65.4% in the evening. The most fires (18.1%) took place on Thursday, and the least (9.1%) on Wednesday.
 Based on the 298 fires from years 2002 - 2018 most fires (14.1%) took place during November, and the least (5.7%) in June.
 Out of all 900 cases reported during the years 2002 - 2018, the most belonged to the categories: Fire (33.1%), Hazardous Condition (23.4%), and False Alarm (16.8%).
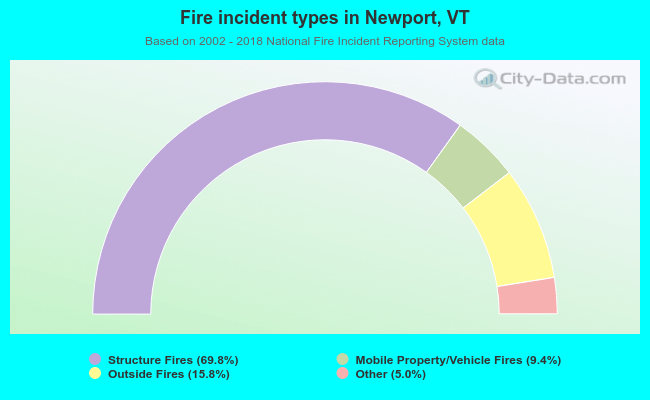 When looking into fire subcategories, the most reports belonged to: Structure Fires (69.8%), and Outside Fires (15.8%).