| Fire incidents reported |
|---|
| Sreet name | Count |
|---|
| FOX RUN ROAD | 160 | | MUTUAL AID GIVEN | 132 | | WOODBURY AVENUE | 94 | | GOSLING ROAD | 78 | | LITTLE BAY ROAD | 26 | | NIMBLE HILL ROAD | 22 | | SHATTUCK WAY | 22 | | SPAULDING TURNPIKE SB | 16 | | OLD DOVER ROAD | 10 | | PISCATAQUA DRIVE | 10 | | BEANE LANE | 8 | | FOX POINT RD | 8 | | FOX POINT ROAD | 8 | | NEWINGTON RD | 8 | | PATTERSON LANE | 8 | | GOSLING RD | 6 | | NEWINGTON ROAD | 6 | | NIMBLE HILL RD | 6 | | SHATTUCK WAY | 6 | | SPAULDING TURNPIKE NB | 6 | | SPAULDING TURNPIKE S.B. | 6 | | AVERY ROAD | 4 | | CONNECTOR RD | 4 | | CROSSINGS OUTER RING RD | 4 | | FABYAN POINT ROAD | 4 |
| | | Fire incidents reported |
|---|
| Sreet name | Count |
|---|
| FOX POINT RD | 4 | | MCINTYRE ROAD | 4 | | PEASE BLVD | 4 | | SPAULDING TURNPIKE N.B. | 4 | | WOODBURY AVE | 4 | | 827 STATE STREET | 2 | | ARBORETUM DR | 2 | | BEANE LN | 2 | | BEANE RD | 2 | | BRICKYARD WAY | 2 | | DUMPLING COVE | 2 | | ENTRANCE TO CROSSINGS | 2 | | FABIAN POINT RD | 2 | | FOX POINT RD RD | 2 | | FOX RUN MALL | 2 | | FRONT OF KOHL'S | 2 | | GOSLING | 2 | | GREAT BAY | 2 | | GUNDALOW LANDING | 2 | | GUNDALOW LANE | 2 | | I95 | 2 | | LAFAYETTE ROAD | 2 | | LITTLE BAY | 2 | | LITTLE BAY RD | 2 | | |
|
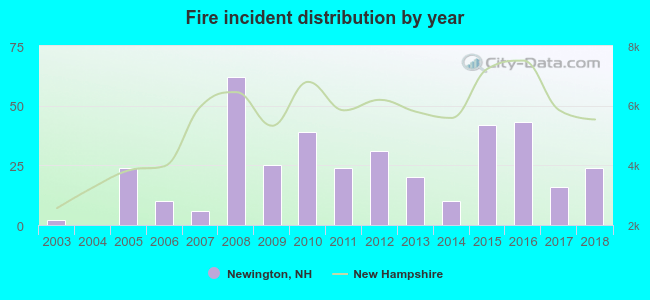 According to the data from the years 2003 - 2018 the average number of fires per year is 24. The highest number of fire incidents - 62 took place in 2008, and the least - 0 in 2004. The data has an increasing trend.
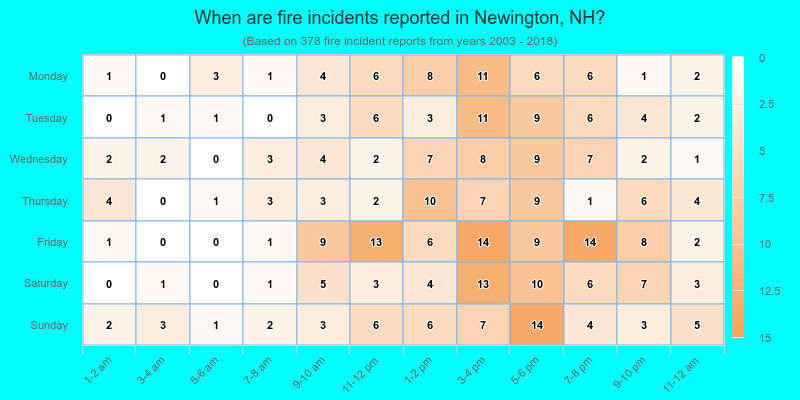
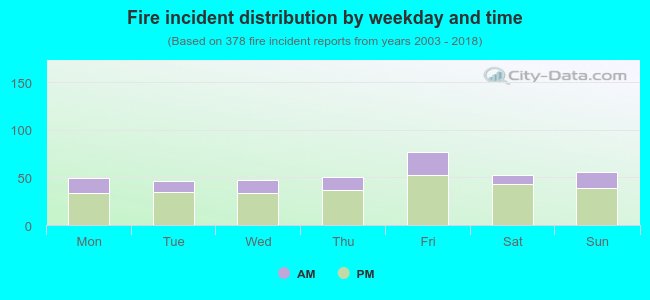 27.2% incidents where reported in the morning and 72.8% in the evening. The most fires (20.4%) took place on Friday, and the least (12.2%) on Tuesday.
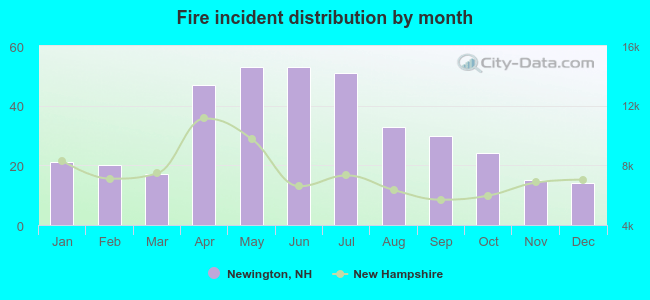 According to the 378 incident reports from years 2003 - 2018 most fires (14.0%) took place during May, and the least (3.7%) in December.
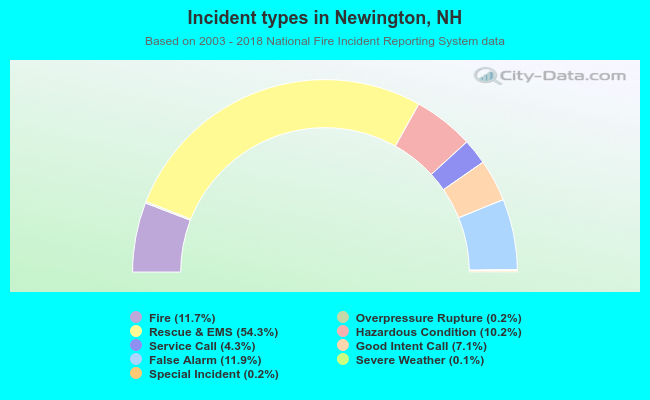 Out of all 3,228 cases reported during the years 2003 - 2018, the most belonged to the categories: Rescue & EMS (54.3%), False Alarm (11.9%), and Fire (11.7%).
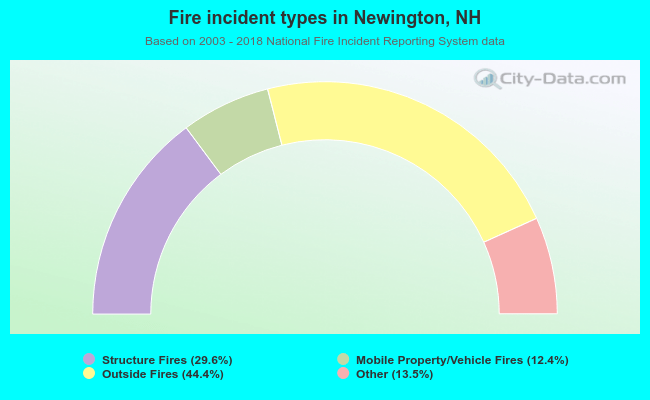 When looking into fire subcategories, the most reports belonged to: Outside Fires (44.4%), and Structure Fires (29.6%).